

Back to top
Sample Report
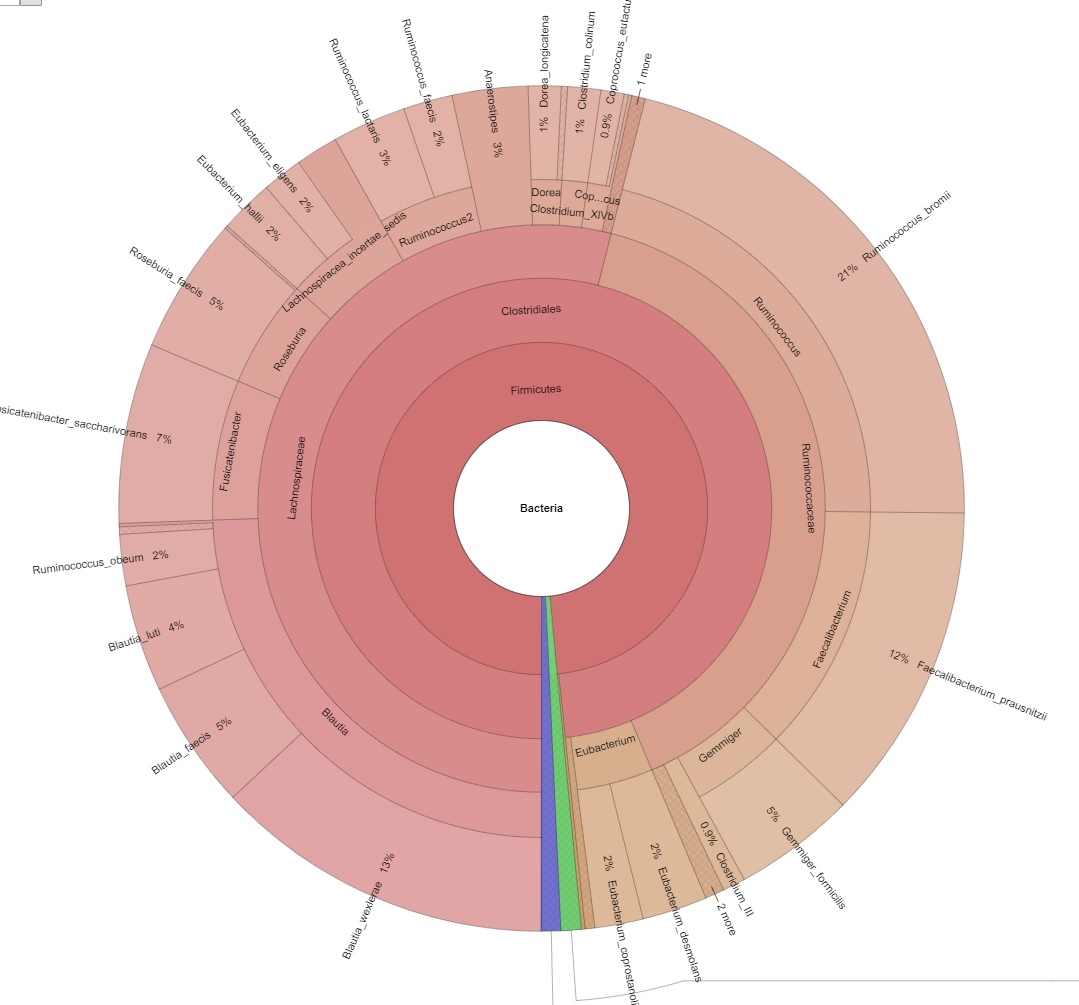
Excerpt from below report. The Krona chart is an interactive summary and visualization of the metagenome.
- Sequencing paired reads are quality checked, trimmed and merged to in-silico re-form the amplified loci – Quality Assessment section.
- Denoising of the data results in representation of the biologically relevant molecules cleaned for noise and chimeras; these representations are also called operational taxonomic units (OTUs) – OTU sequences (fasta).
- Each OTU is assigned its taxonomy using reference databases like the one provided by the Ribosomal Database Project (RDP) – OTU taxonomies (confidences; plain text).
- The abundance of each OTU across samples is determined – OTU relative abundance (html).
- Community analysis is done, calculating the rarefaction curves and alpha diversity of each sample – Alpha diversity.
- Results of the metagenome analysis are visualized by interactive Krona charts – Krona charts.
- If an experimental design exists, which divides samples into groups (e.g. treated and controls), beta diversity may be measured and differential OTU analysis may be done – complementary service (not displayed in the standard report).
-
Using the composition of the community in the samples - metabolic pathway databases may be queried to assess the functional profile of the community – complementary service (not displayed in the standard report).
Amplicon Sequencing Analysis
Guidance
Guidance pageQuality Assessment
Quality assessment for each sample| Sample | Reads QC (html) |
| Sample-1 | R1 reads ; R2 reads ; Merged reads |
| Sample-2 | R1 reads ; R2 reads ; Merged reads |
| Sample-3 | R1 reads ; R2 reads ; Merged reads |
The Merging report (tsv) lists the percentages of reads merged per sample from the remaining trimmed reads.
The Unassigned reads (fasta) contains chimeric reads, singletons and reads that were not assigned to a final OTU.
MultiQC Summaries
Interactive reports providing a broad overview.
Analysis Results
The following sections summarize the results of the amplicon analysis.
Summaries
- OTUs per sample (plain text)
- Reads per sample (plain text)
- Reads per OTU (plain text)
- OTU fasta info (plain text)
- OTU table stats (plain text)
OTUs
- OTU sequences (fasta)
- OTU taxonomies (confidences; plain text)
- OTU relative abundance (html)
- OTU normalized, reordered abundance (html)
- OTU core microbiome (tsv)
- Combined table as html or tsv (abundance, sequence and taxonomy confidence)
- Access to OTUs folder (for rarefied, presence, unfiltered OTU tables, etc.)
Taxonomies
- Domain aggregation (html)
- Kingdom aggregation (html)
- Phylum aggregation (html)
- Class aggregation (html)
- Order aggregation (html)
- Family aggregation (html)
- Genus aggregation (html)
- Species aggregation (html)
Downstream Analysis Results
Visualization of Results
- Read distribution
- OTUs and samples (pdf)
- OTU distribution
- Abundance overview (pdf)
- Heatmap (pdf)
- Heatmap reordered (pdf)
- Phylogenetic tree (pdf)
- Krona charts
- Interactive summary and visualization of the metagenome (html)
- Sample diversity
- Alpha diversity
- Alpha diversity octave plot (pdf), scatter plot and table (tsv)
- Rarefaction curves (pdf) and table (tsv)
- Access to alpha diversity folder
- Alpha diversity
Further Analysis Possibility
The cleaned biom data is stored as a phyloseq R data object in the R_objects folder.
Entire Analysis
Access to the entire 16S project folder.
Certification and Quality
Microsynth is a leading European company in nucleic acid synthesis and analysis. Up to date we put every effort in constantly improving the underlying processes. All branches of Microsynth are EN ISO 9001:2015 certified. The NGS and Sanger sequencing department as well as the paternity testing services of Microsynth are additionally ISO/IEC 17025:2005 accredited (STS 0429). Microsynth is also authorized by SwissMedic to perform quality control of medicinal products by GMP Sanger sequencing. Further, Microsynth is EN ISO 13485:2016 certified for the analysis, production and distribution of nucleic acids, in-vitro diagnostic (IVD) assays and applications.