

Back to top
nanoCORE Amplicon Metagenomics

nanoCORE Amplicon Metagenomics is Microsynth’s end-to-end ONT-based sequencing service for microbial community profiling. Select from six validated marker regions to characterize bacterial (16S), archaeal (16S Archaea), or fungal (ITS) communities.
For added convenience, DNA extraction can be included for soil and fecal samples. Sequencing data are processed through our standardized bioinformatics pipeline, enabling species-level resolution for suitable marker regions and taxa.
Simply configure your project in the Microsynth webshop, receive instant pricing, and submit your order online – no quotation required.
Modular Workflow
Outsource the complete workflow or select specific modules. Our process is designed for flexibility. Typical steps include:
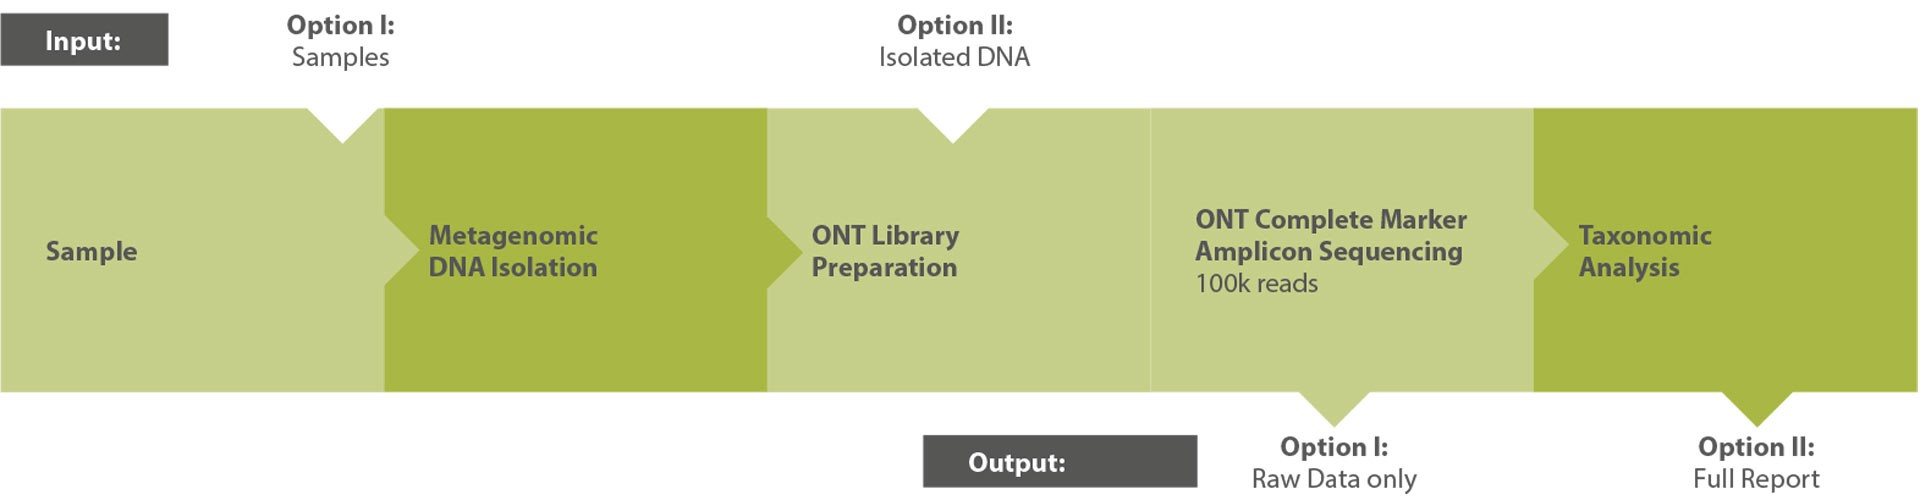
Raw data includes:
- Sequencing quantity and quality assessment (.xlsx)
- Raw sequencing data (.fastq per sample)
- Summary report (.pdf)
Primer Systems
Choose the primer system that best fits your research focus.
| Target Organism / Application | Primer System | Amplicon Size (bp) | Key Benefit |
| Bacteria (broadest coverage) | 16S Advanced | ~1500 |
Microsynth’s custom full-length 16S rRNA primer. Specifically |
| Bacteria | 16S ONT | ~1500 | Full-length 16S rRNA gene using Oxford Nanopore’s kit primer. Compatible with ONT workflows but less comprehensive than Microsynth’s 16S Advanced primer. |
| Archaea | 16S Archaea | ~1000 | Specifically optimized to amplify diverse and novel archaeal taxa from environmental samples. |
| Fungi & other Eukaryotes* |
ITS1-4 | ~1200 | Pan-eukaryotic metabarcoding based on full-length ITS. Useful for fungal and broader eukaryotic community analysis. |
| Fungi (optimized) | ITSFu | ~1200 | Tailored towards fungal ITS amplification. Recommended if fungal identification is your main focus. |
| Eukaryotes incl. fungi* |
18S-ITS | up to 1500 | Combines 18S fragment with full ITS sequences for pan-eukaryotic profiling including fungi. |
*Note: Amplification may also capture non-fungal eukaryotic DNA (e.g. plants).
Bioinformatics Analysis
Our standardized bioinformatics workflow transforms raw ONT amplicon sequencing data into biologically meaningful insights, providing an intuitive overview of microbial community composition, diversity, and taxonomic structure.
The analysis results are delivered as a comprehensive set of publication-ready figures, interactive visualizations, and data files, including:
- Comprehensive report (.html) – interactive summary with filtering and sorting functions
- OTU sequences (.fasta) – full-length operational taxonomic units
- Abundance and taxonomy tables (.tsv) – OTU counts, taxonomy assignments, and confidence scores
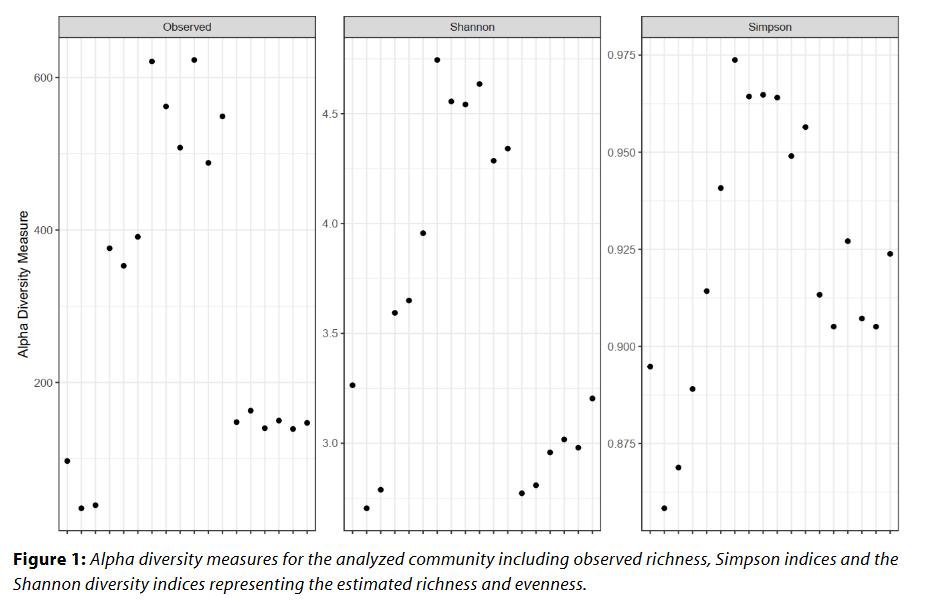
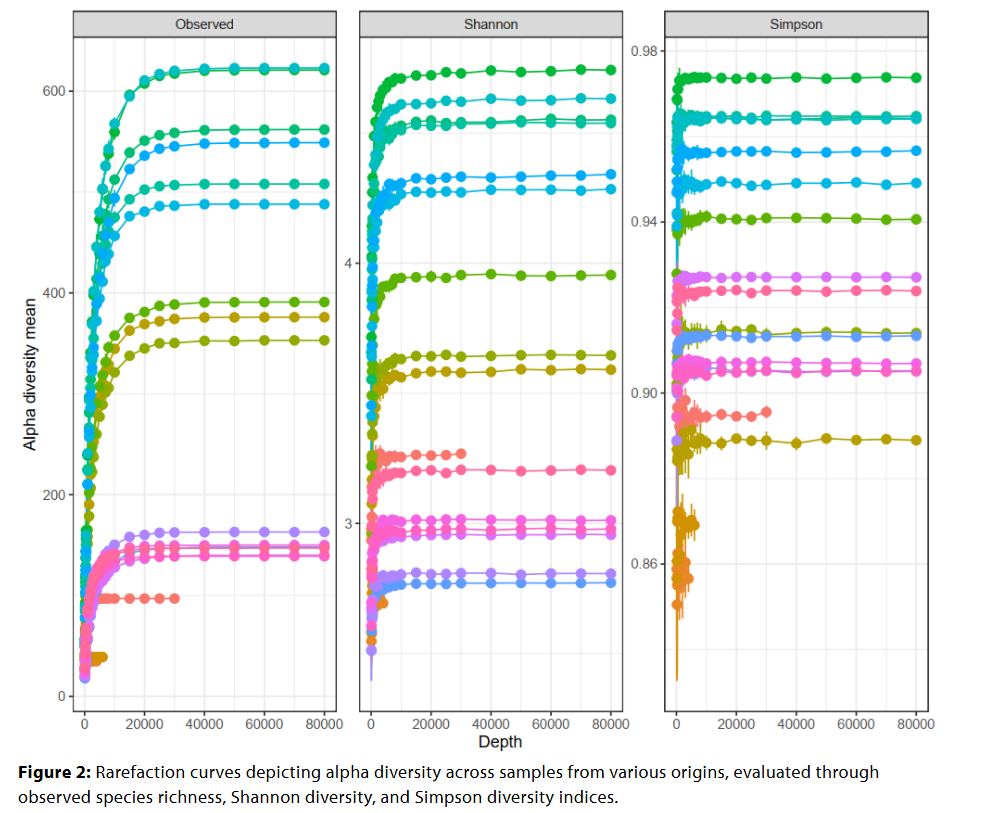
- Diversity analysis (.tsv, .pdf) – intra- and intersample diversity metrics with rarefaction curves
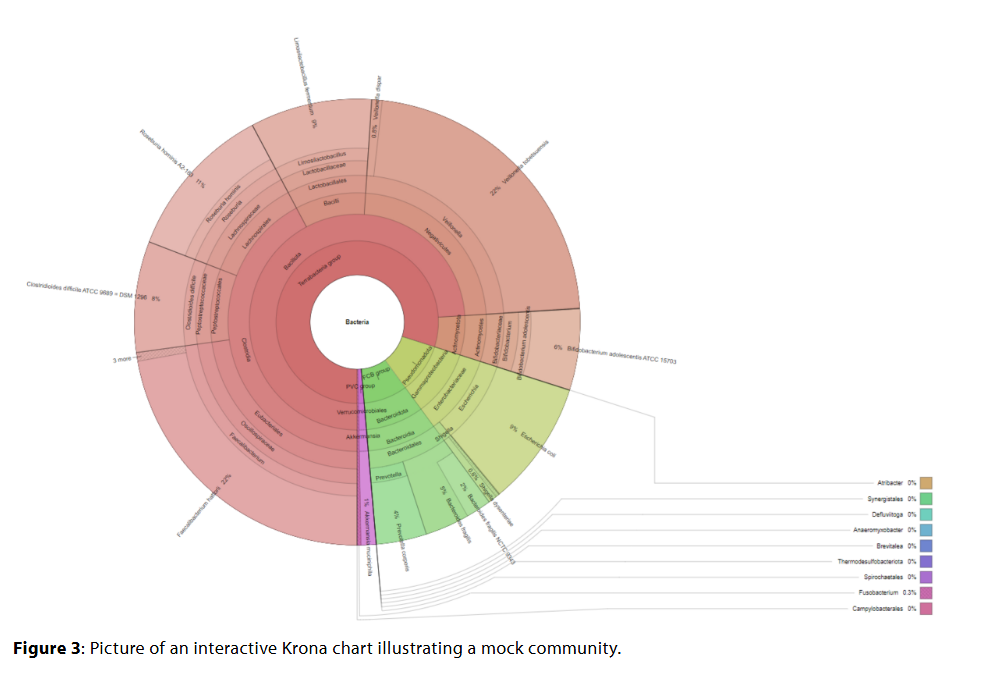
- Krona chart visualization (.html) – interactive graphical exploration of community composition
- Principal component analysis (.tsv, .pdf) – overview of sample relationships and clustering
- Statistical analysis visualizations – clear graphical representation of results
Example Results
All results are delivered in publication-ready figures and interactive formats, providing both high-level overviews and nucleotide-level detail.
Turnaround Time
- Library preparation and sequencing only: 8 working days
- Bioinformatics analysis: +2 working days
- DNA isolation: +5 working days
- Express processing is available on request, subject to feasibility
Sample Requirements
- See User Guide
Custom Services (Available on Request)
If our standard nanoCORE service does not fully meet your project requirements, Microsynth also offers customized solutions. Depending on your needs, we can support additional sample types for DNA extraction, custom primer systems, and advanced bioinformatics analyses.
Please share your project requirements with us, and we will assess their feasibility and provide a customized quotation where appropriate.