

Back to top
miCORE Whole Genome Metagenomics

Unbiased community profiling. Reveal taxonomy and function at species- or strain-level precision. Transcend domain boundaries for a truly comprehensive view.
From soil and water to host-associated samples, shotgun metagenomics enables comprehensive analysis of all DNA in your sample. Go beyond marker genes to uncover taxonomic composition, metabolic potential, and functional elements such as antibiotic resistance and virulence factors.
From soil and water to host-associated samples, shotgun metagenomics enables comprehensive analysis of all DNA in your sample. Go beyond marker genes to uncover taxonomic composition, metabolic potential, and functional elements such as antibiotic resistance and virulence factors.
What You Can Achieve
- Characterize bacterial and fungal communities
- Identify organisms and estimate relative abundances down to species or strain level
- Detect viruses in complex samples, including host tissues and exudates
- Explore metabolic functions, e.g., antibiotic resistance genes, virulence factors, etc.
- Conduct gene-level analysis of uncultivable microorganisms
- Track community shifts and evolutionary adaptations under changing conditions
Before You Start
To set up your shotgun metagenomics project effectively, consider:
- Sample source and quantity – origin and amount of material available
- Sequencing depth – level of sensitivity needed to detect rare organisms
- Community complexity – taxonomic diversity and expected composition
- Research focus – taxonomy, function, or both
- Method choice – is Whole Genome Metagenomics or Amplicon Metagenomics the better fit?
- Data analysis – availability of computational resources and bioinformatics expertise
Modular Workflow
Outsource the complete workflow or select specific modules. Our shotgun metagenomics process is designed for flexibility.
Typical workflow steps include:

Raw data includes:
- Sequencing quantity and quality assessment (.xlsx)
- Raw sequencing data (.fastq per sample)
- Project summary report (.pdf)
Bioinformatics Analysis
Our Whole Genome Metagenomics analysis module combines intensive computing with optimized tools for reliable results. Typical analyses include:
- Data quality control
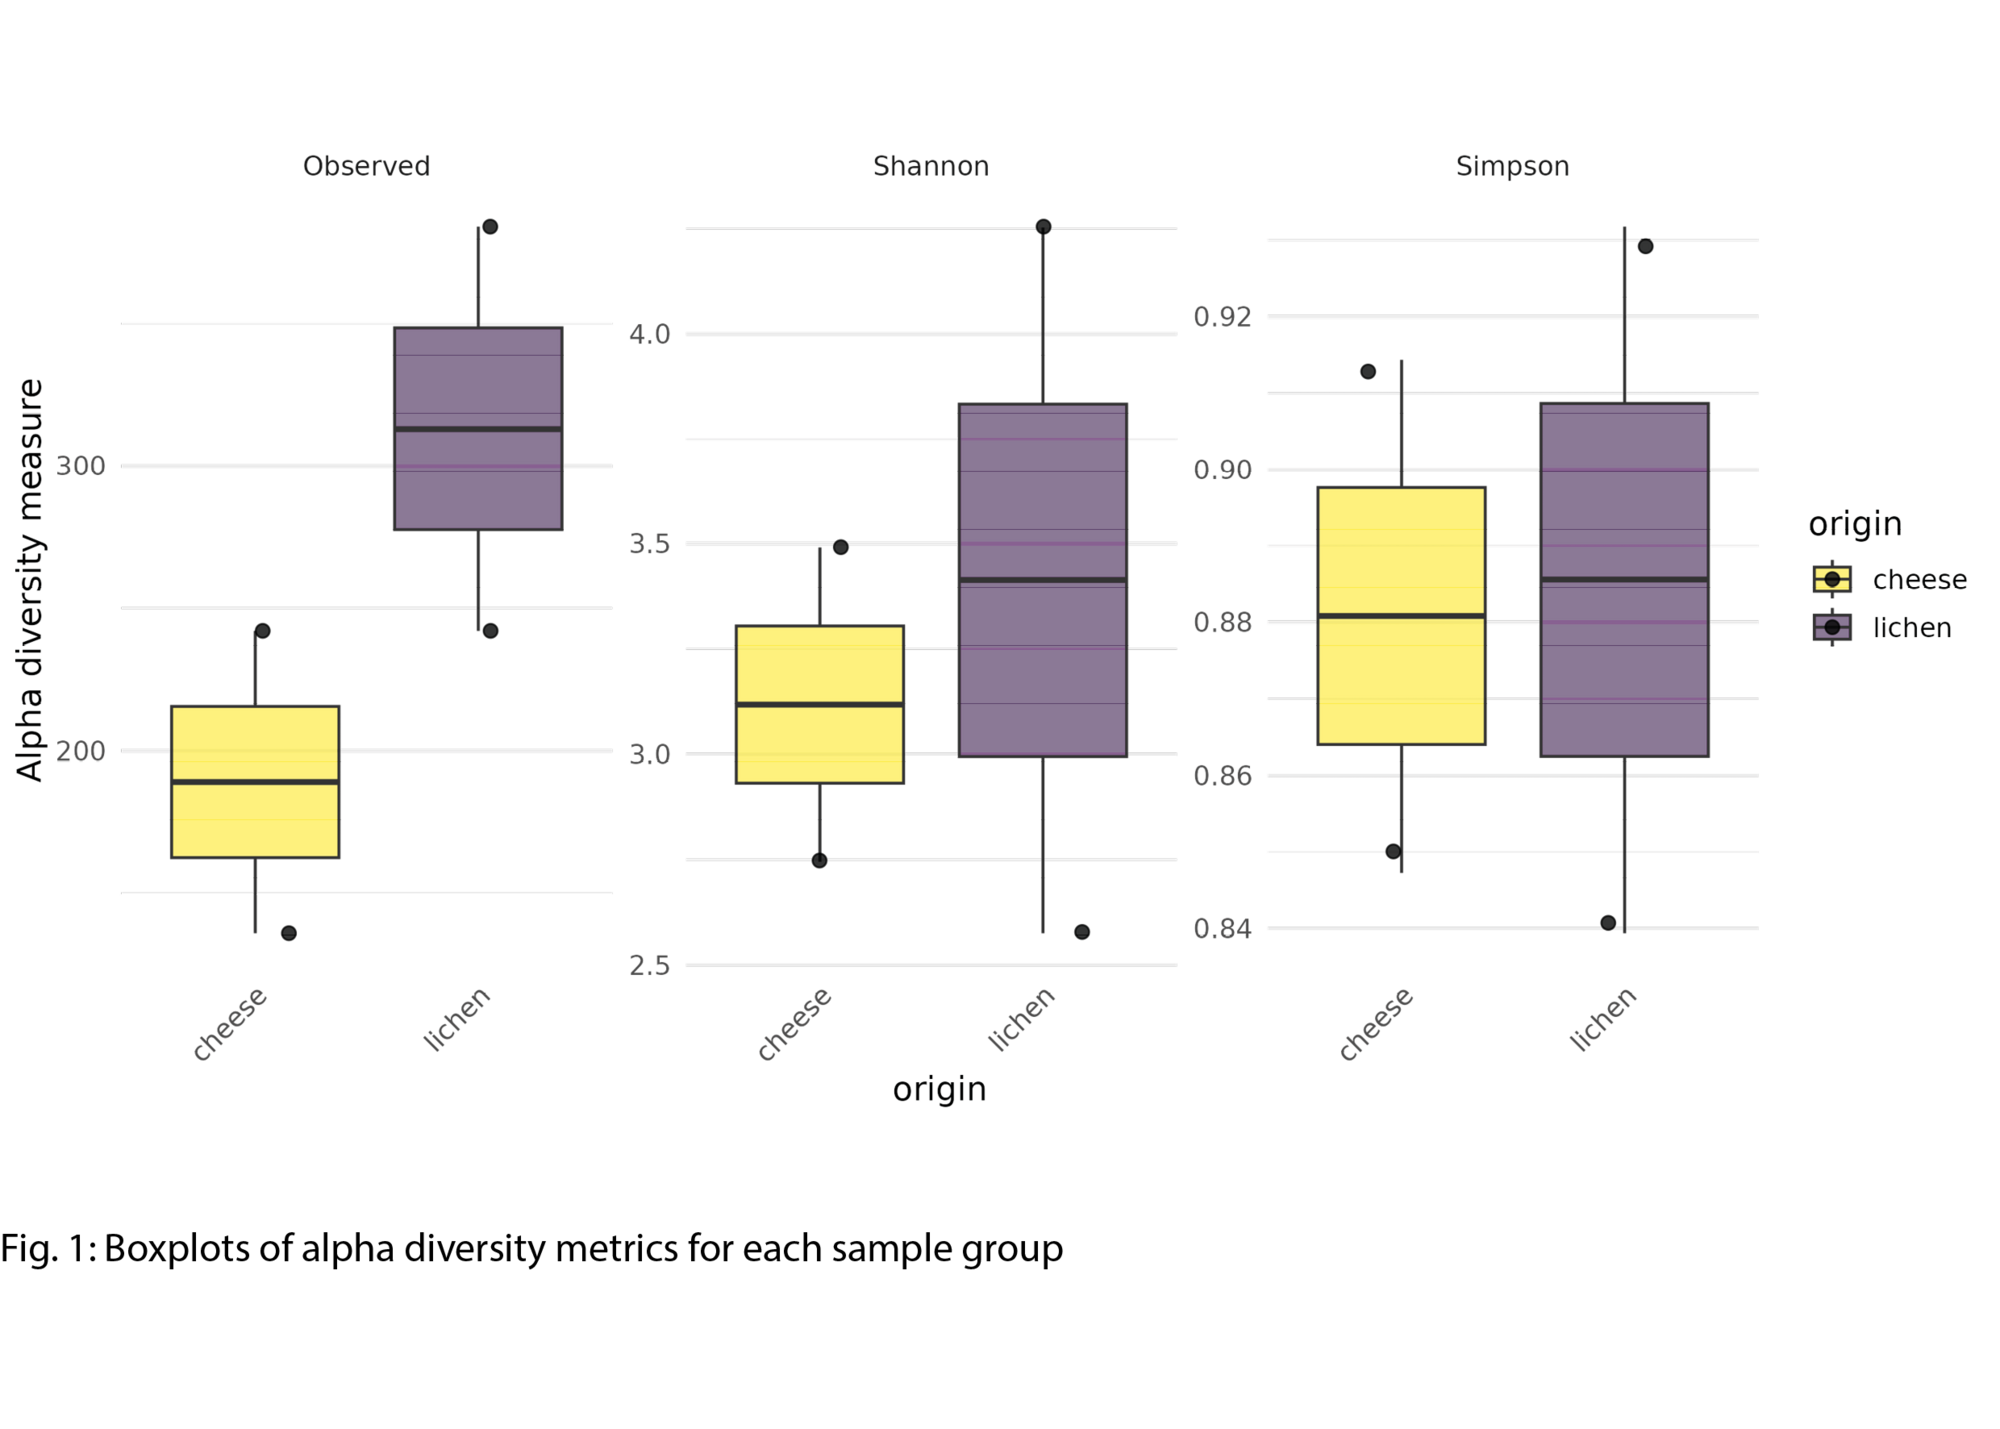
- Taxonomic profiling of organisms from all biological domains
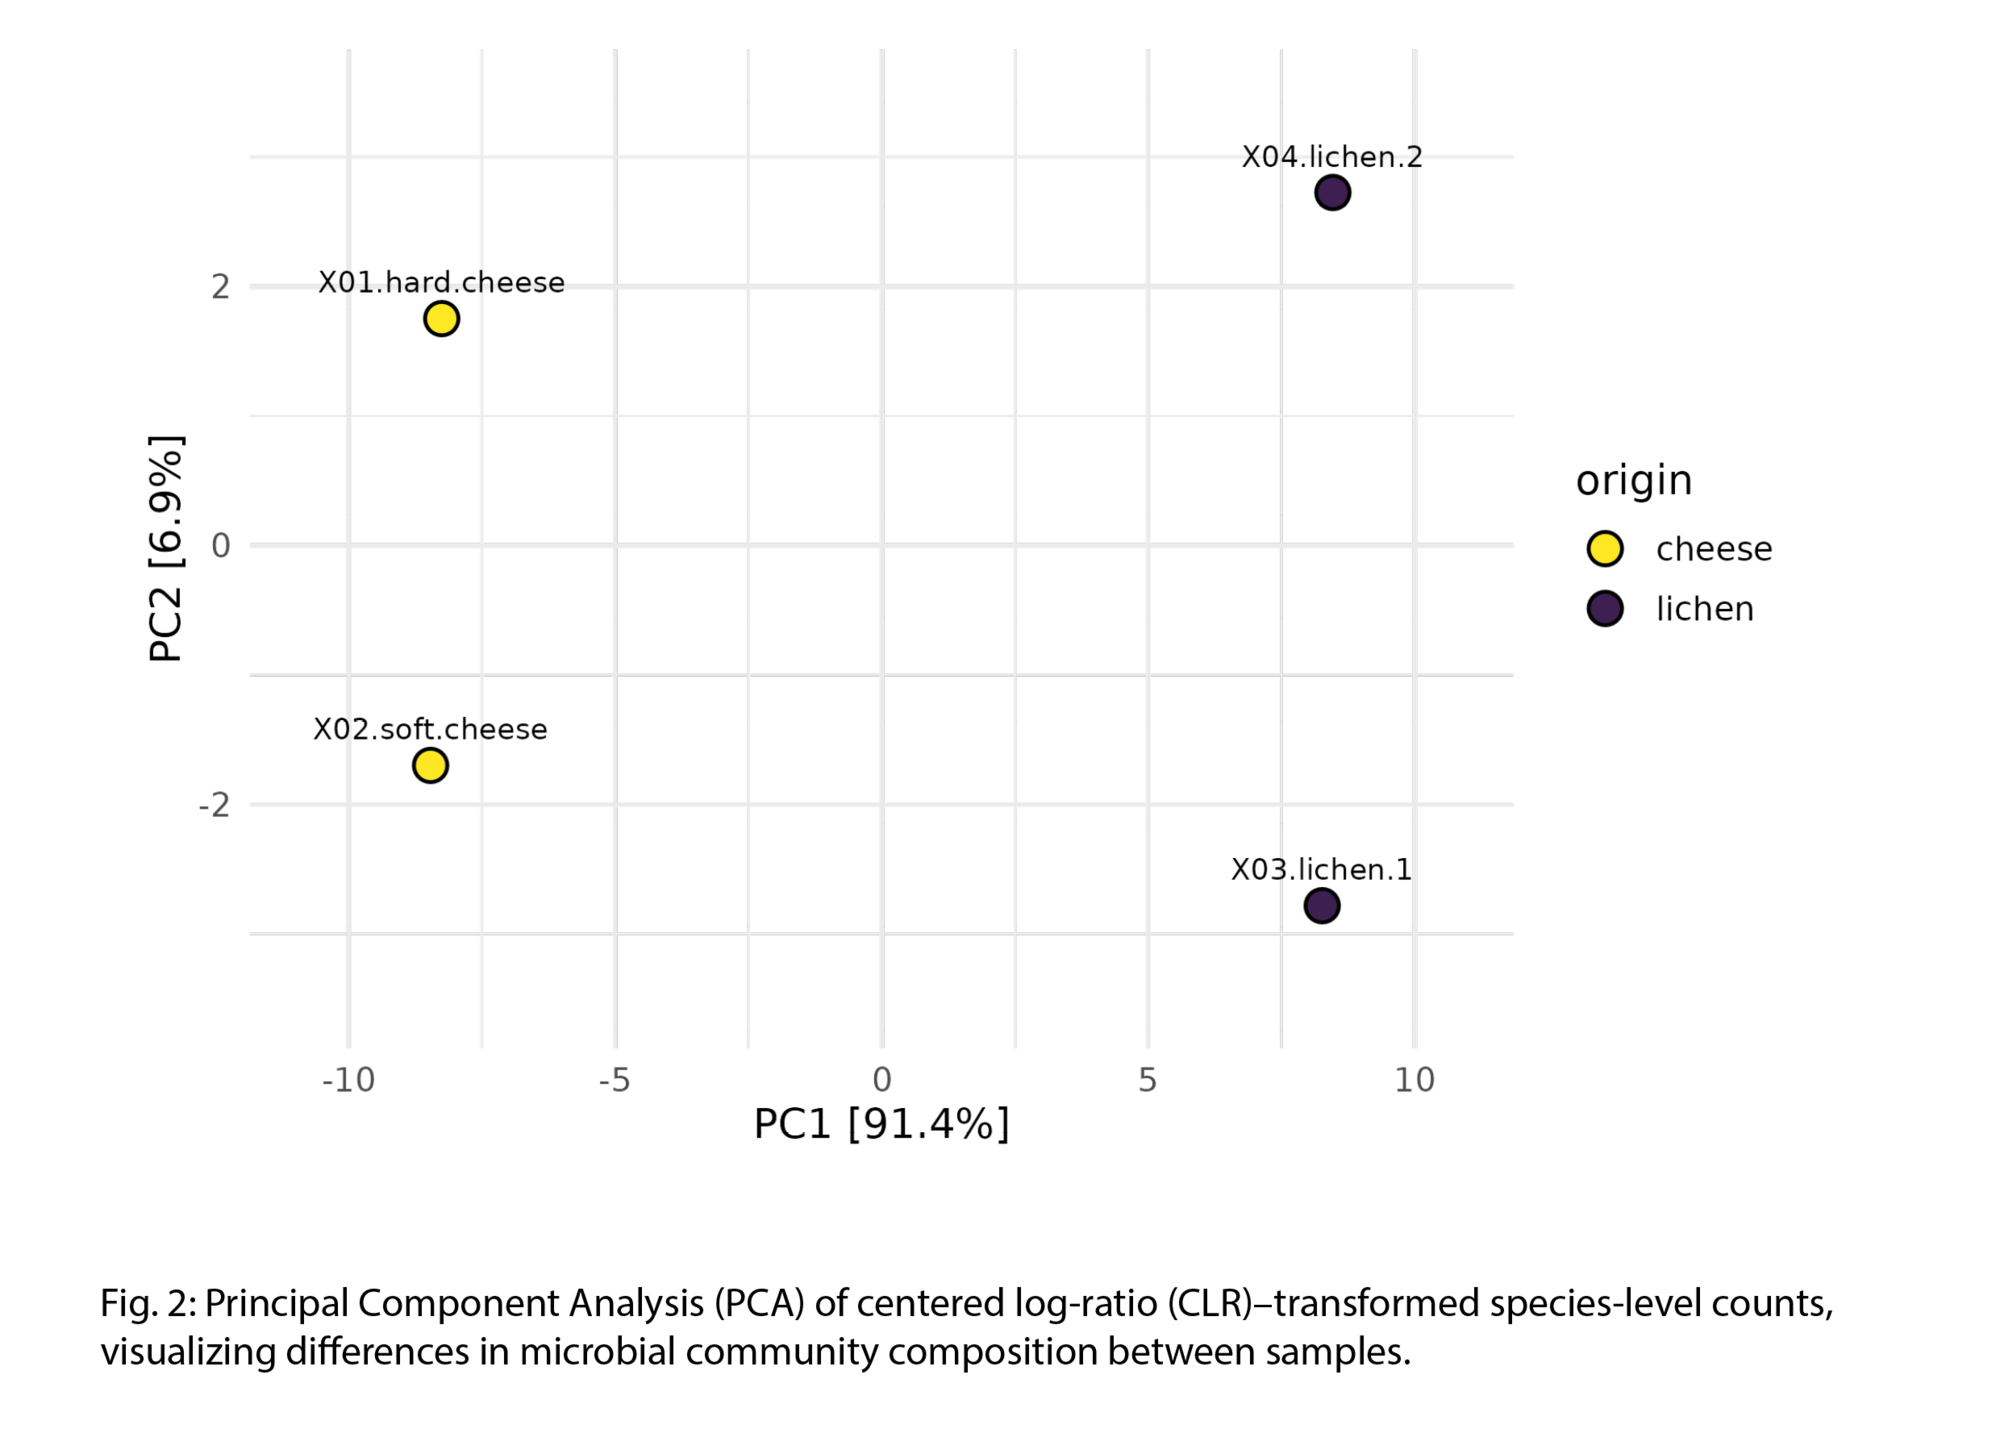
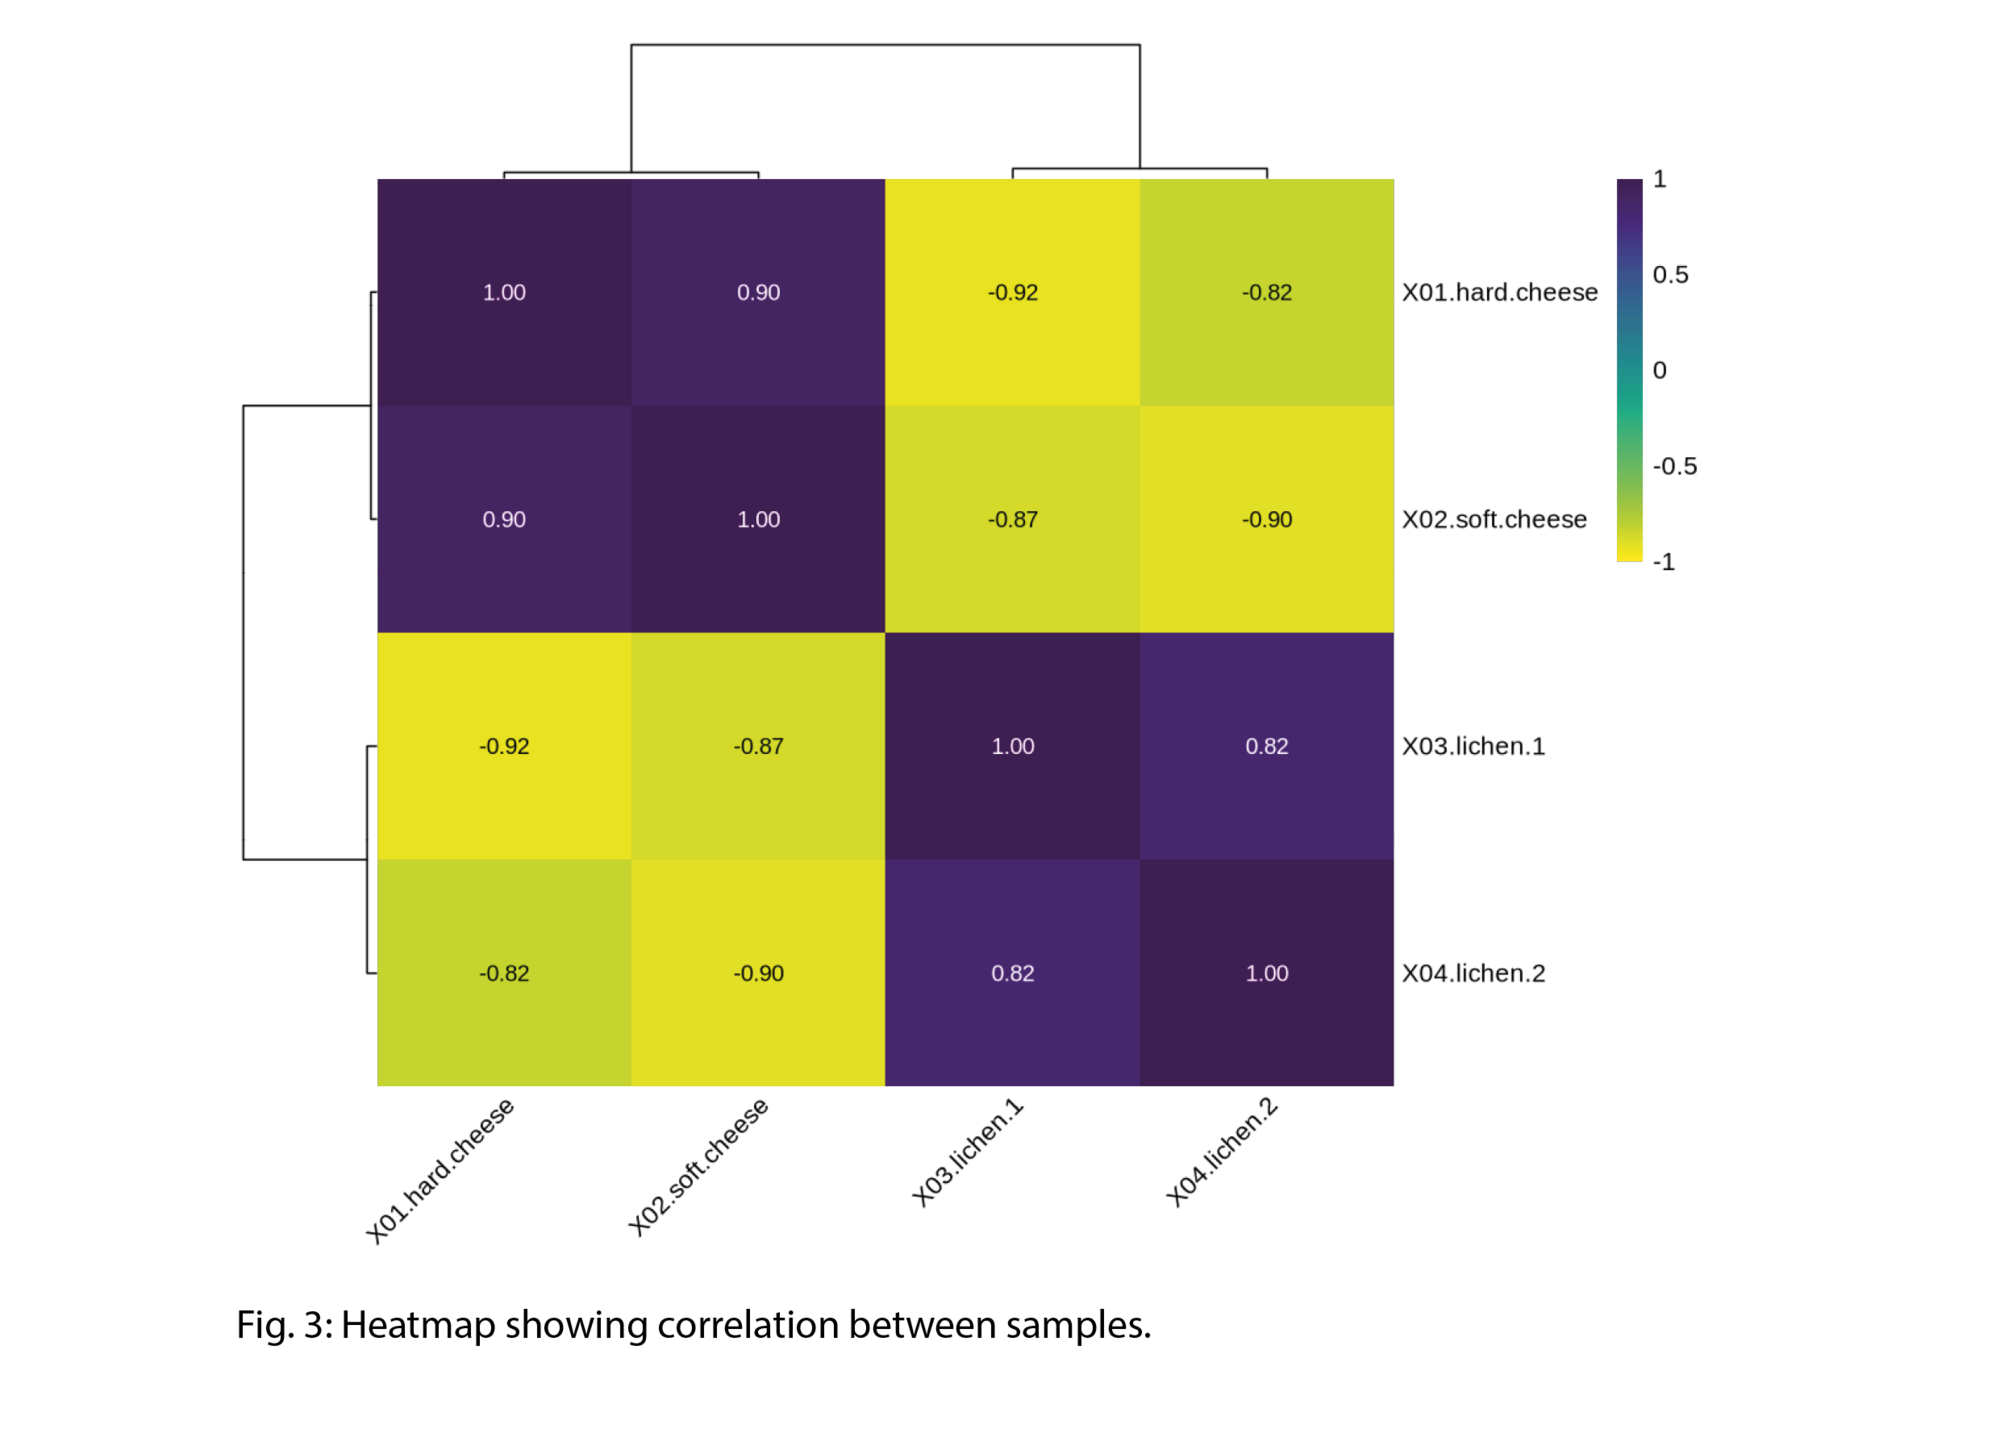
- Clustering of samples based on community composition
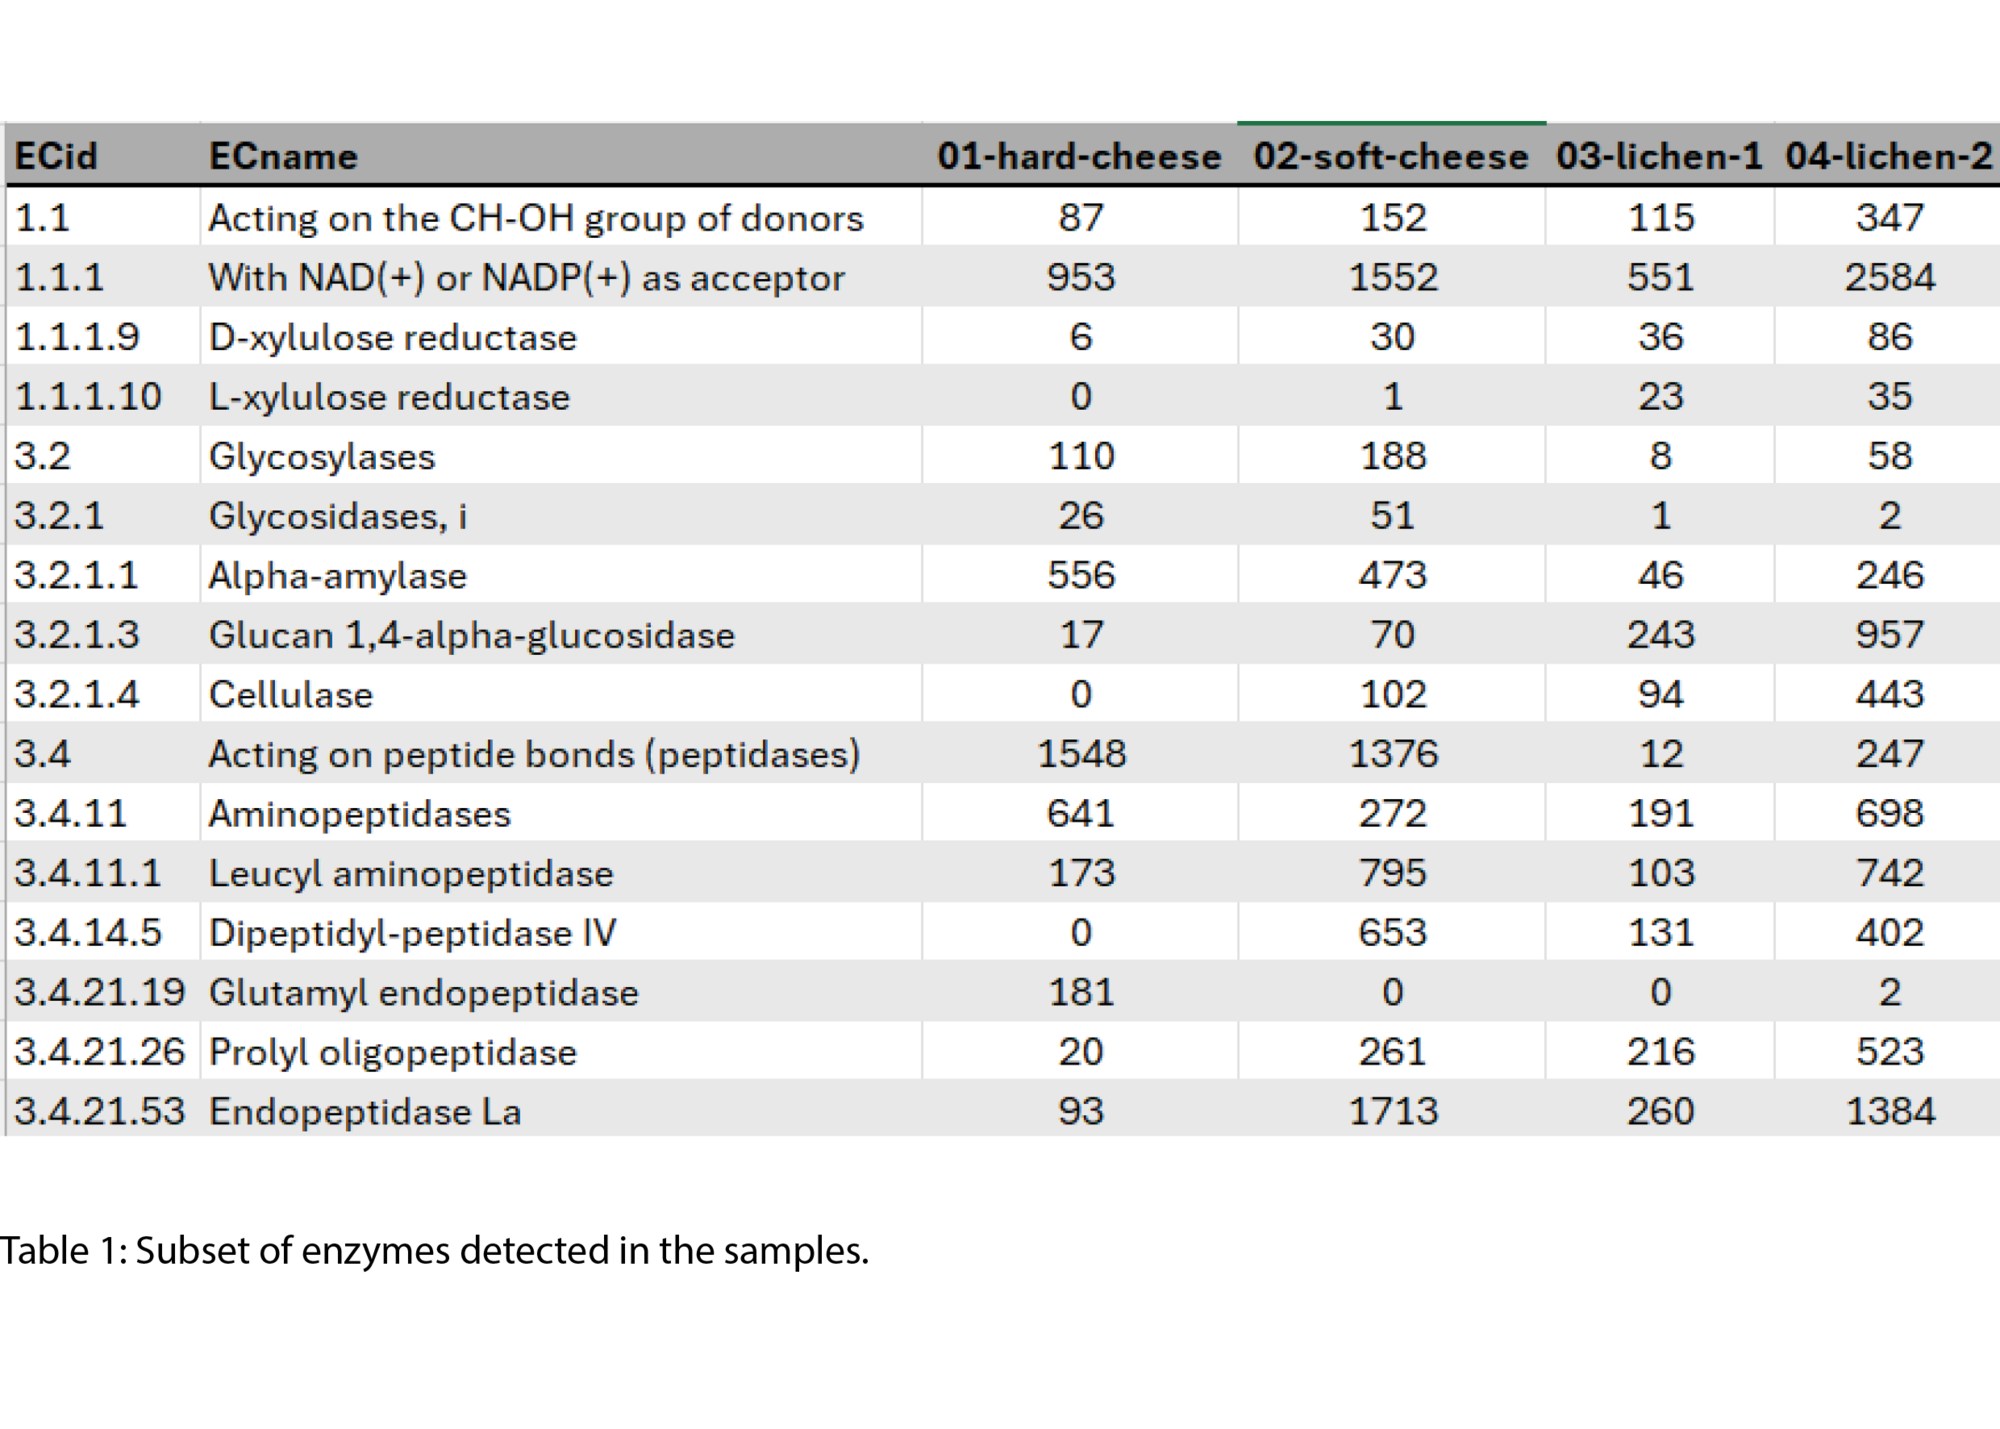
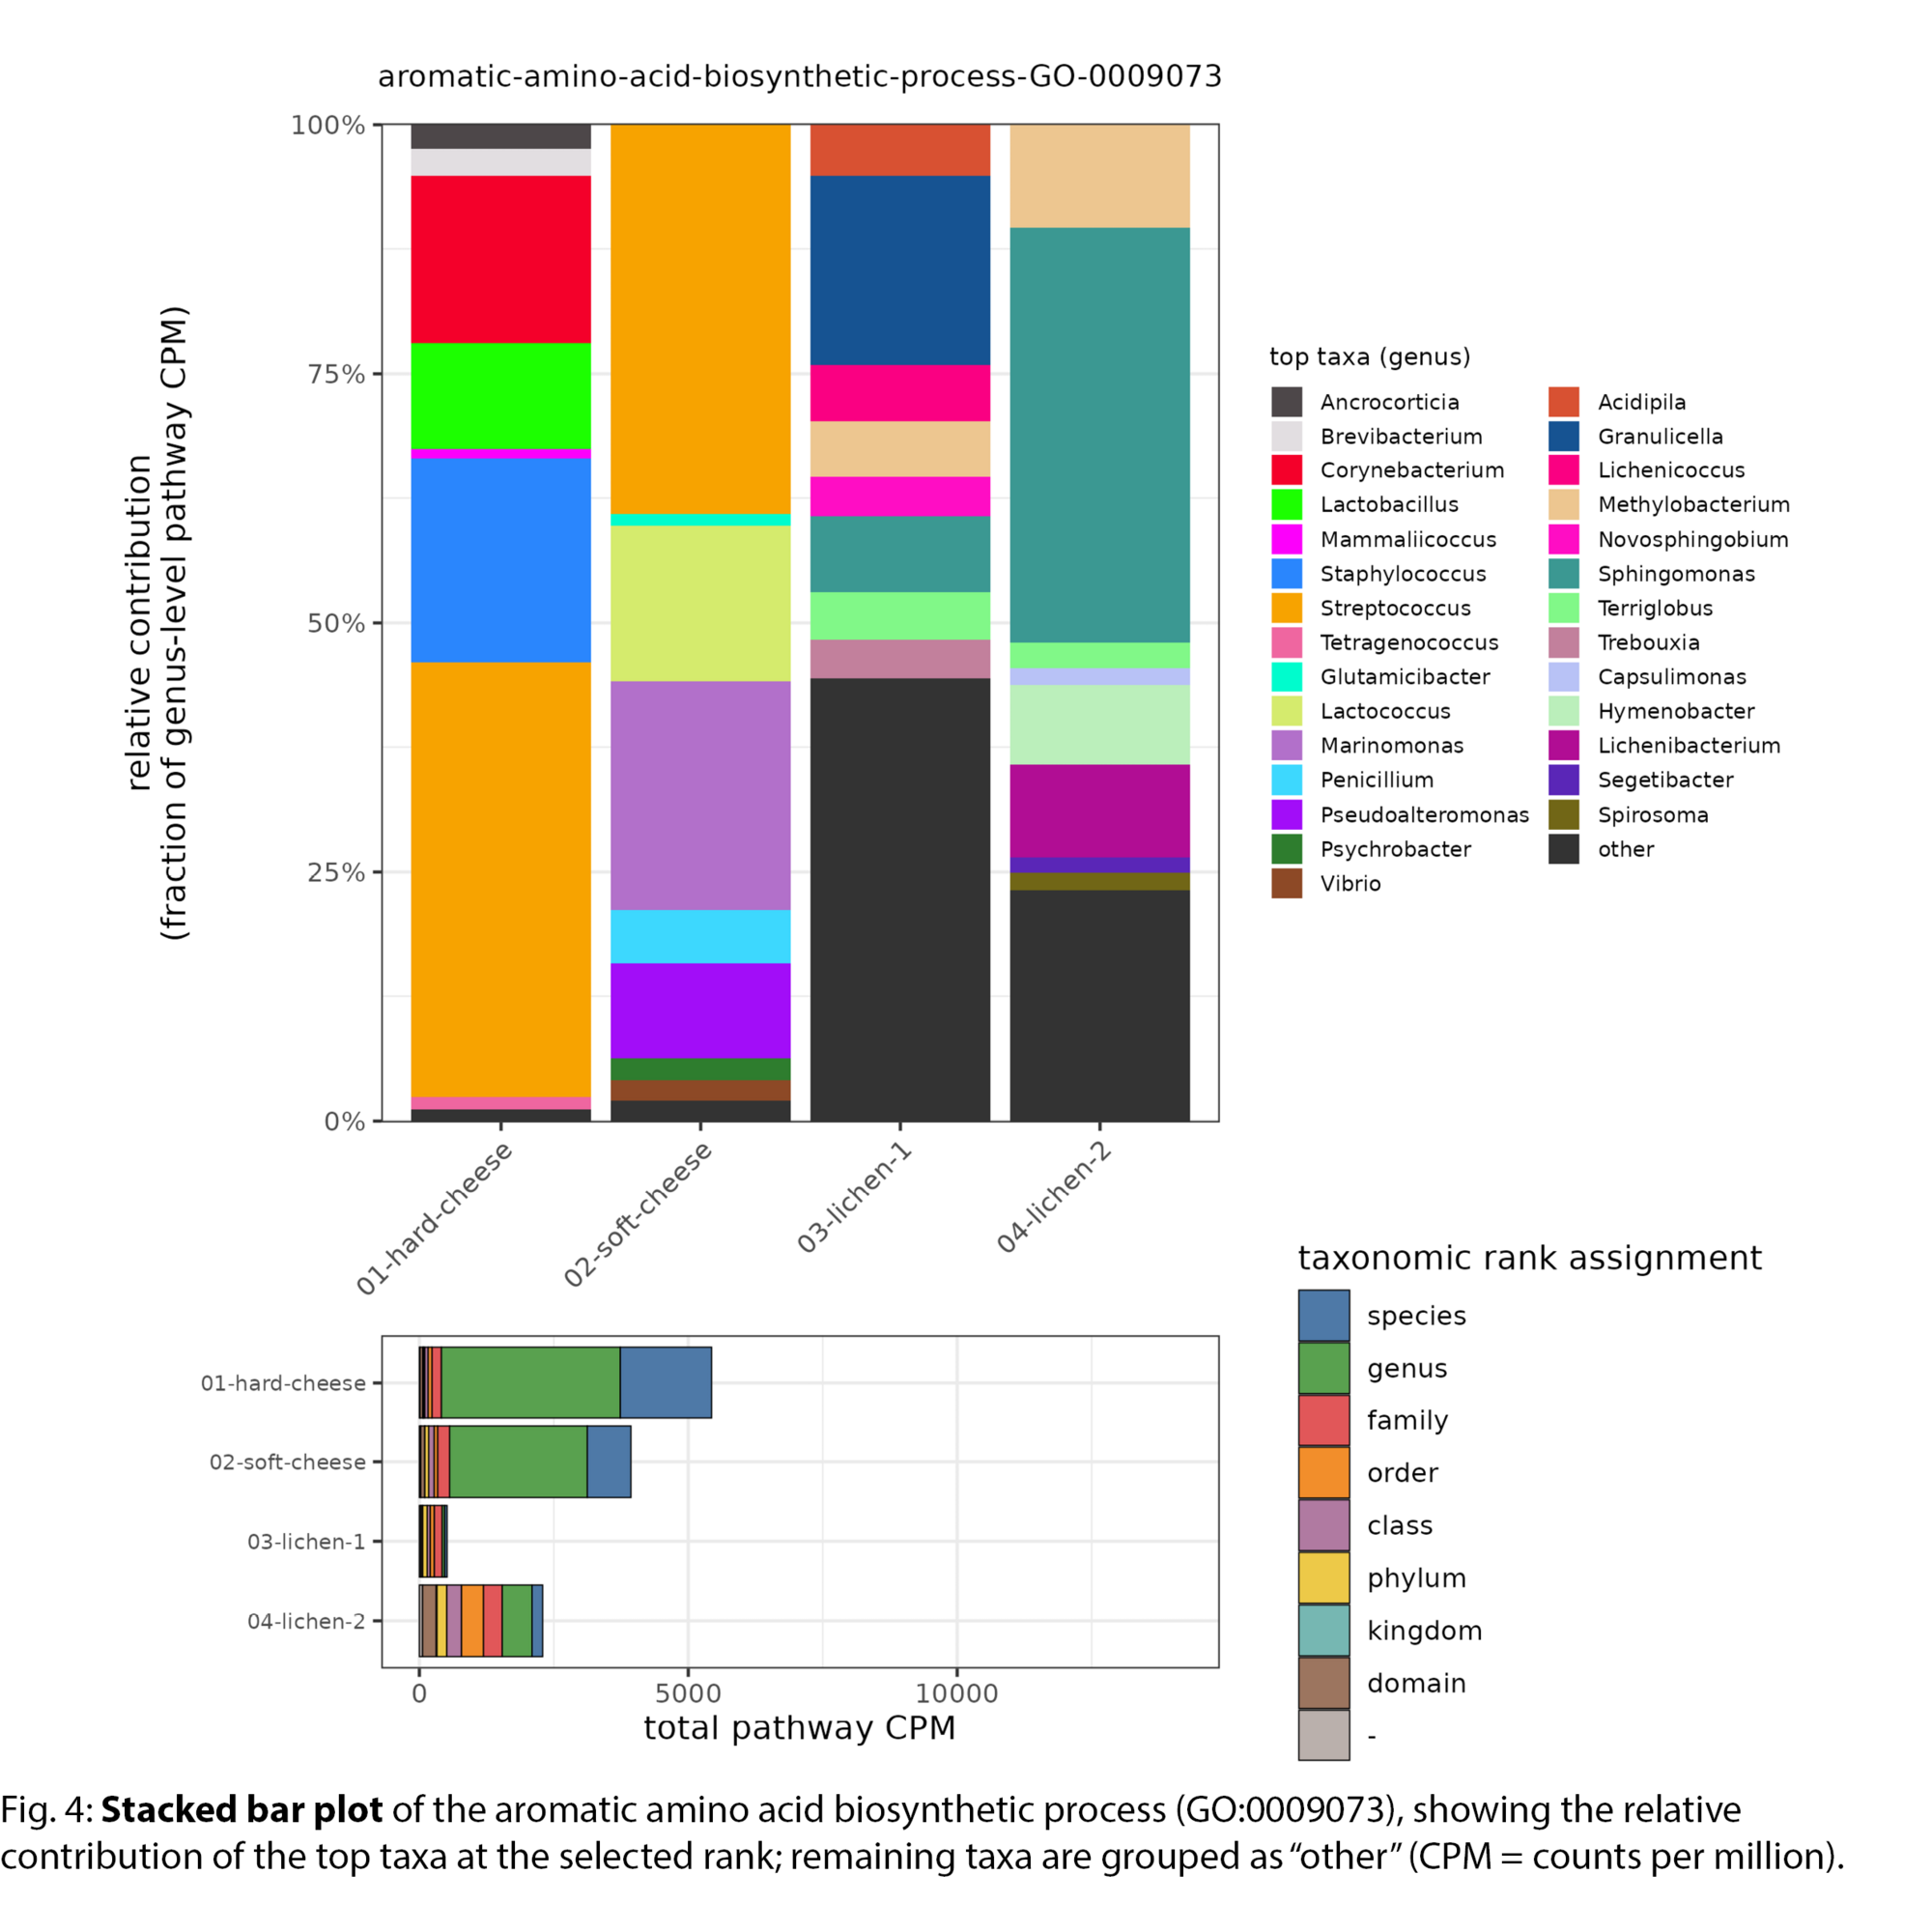
- Functional annotations
- Visualization with interactive charts (e.g., Krona plots)
Example Results
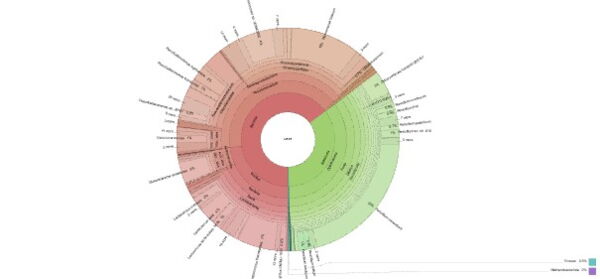
Click to explore the interactive Krona chart showing taxonomic composition from domain to species level.
Turnaround Time
- Sequencing only: 20 working days
- Full analysis: +15 working days
- Taxonomy-only analysis: +5 working days
- Express service available upon request
Sample Requirements
- See User Guide
Notes
- Related services: miCORE Amplicon Metagenomics, nanoCORE Amplicon Metagenomics, Shotgun Metatranscriptomics, BacterialSeq.