

Back to top
Amplicon Metagenomics - 16S/ITS

- Explore the taxonomic community composition – bacteria or fungi – of your samples
- Compare taxonomic shifts within an experimental setup
- Optimize your next sampling experiment
Overview
Considerations before starting a amplicon metagenomics project:
- Scientific objective
- Starting material & desired Services (Isolation to Bioinformatics)
- Standard or custom Marker & Primer set
- Amplicon length (suitable for Illumina short read Sequencing)
- Sample complexity/Sequencing Depth
- Experimental setup (amount of samples , Replicates, Conditions to compare)
Let us guide you – from design to analysis
Example projects using amplicon metagenomics:
- Detect nutrition dependent gut bacterial community shifts
- Investigate the genetic diversity of archaea in deep sea hydrothermal vent environments
- Observe community shifts in a bioreactor setup
- Characterize the fungi spores from air
Applications related to amplicon metagenomics:
- Shotgun metagenomics
- Shotgun metatranscriptomics
Workflow
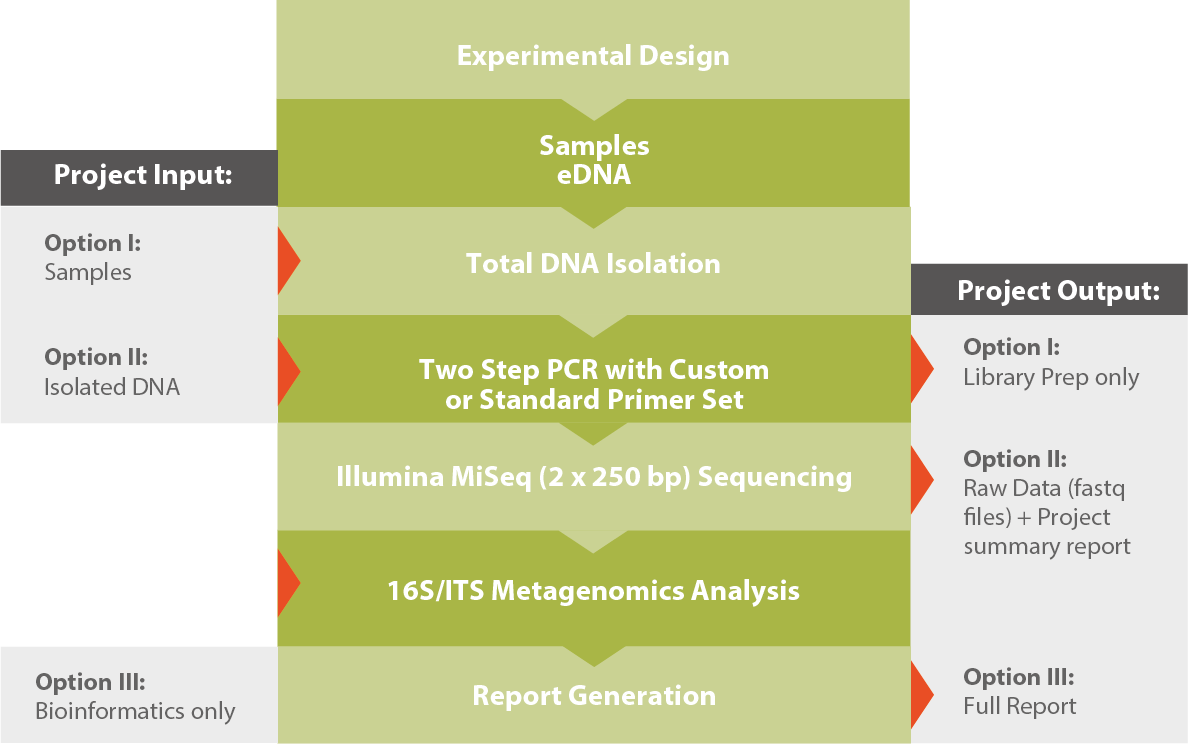
For further reading and a detailed technical description, please download our Application 16S/ITS Metagenomics Sequencing (see related downloads).
Results
Without Bioinformatics
Raw Data
If you haven't ordered a bioinformatics analysis module, Microsynth provides the following key outcomes for 16S/ITS metagenomics:
- Assessment of Sequencing Quantity and Quality (in .xlsx format)
An evaluation of the quantity and quality of your sequencing data. - Raw data ( per sample, in .fastq format)
The raw data allowing you to run your own analysis or track back to each nucleotide sequenced. - Project Summary Report (.pdf format)
A report summarizing the project's key parameters.
With Bioinformatics
Standard Bioinformatic Analysis
With Microsynth's standard bioinformatics analysis module for 16S/ITS metagenomics, you'll receive comprehensive insights:
- Comprehensive report (in interactive .html format)
This detailed report guides you through the data, allowing sorting and filtering of key results interactively. - Amplicon Sequence Variants (ASVs) (in .fasta format, see Table 1)
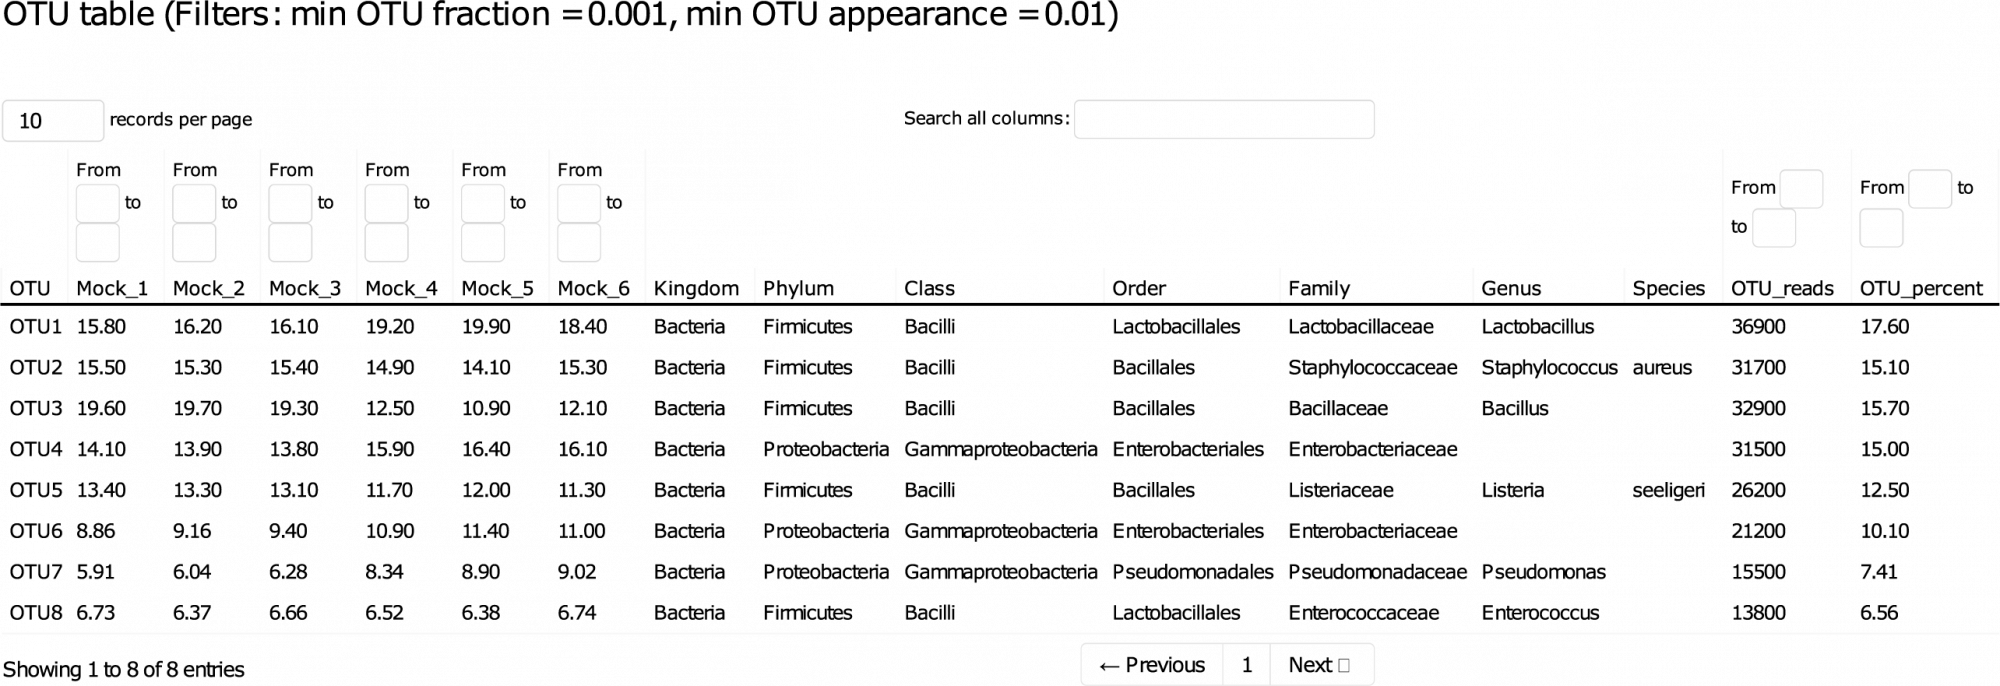
ASVs, also known as zero-radius operational taxonomic units (zOTUs), in .fasta format. - ASV Abundance, Taxonomy, and Prediction Confidence (in .tsv and .xlsx format)
Insights into ASV abundance, taxonomy, and prediction confidence. - Intrasample Diversity Analysis and Rarefaction Curves (in .tsv and .pdf format, see Figure 1)
Explore intrasample diversity and estimate metagenomic coverage using rarefaction curves. - Metagenome Visualization via Krona Charts (in interactive .html format, see Figure 2)
Easily interpret and explore your metagenomic data through interactive Krona Charts.
These results provide a comprehensive understanding of your experiment, from an overview down to the nucleotide level, empowering you to make informed decisions and draw meaningful conclusions.
Complementary Bioinformatic Analysis (at additional costs):
1. Comparative Analysis
- Inter-Sample Diversity (in .tsv and .pdf format, see Figure 3)
Gain insights into diversity across samples, presented in both tabular and graphical formats. - Principal Component Analysis (in .tsv and .pdf format, see Figure 3)
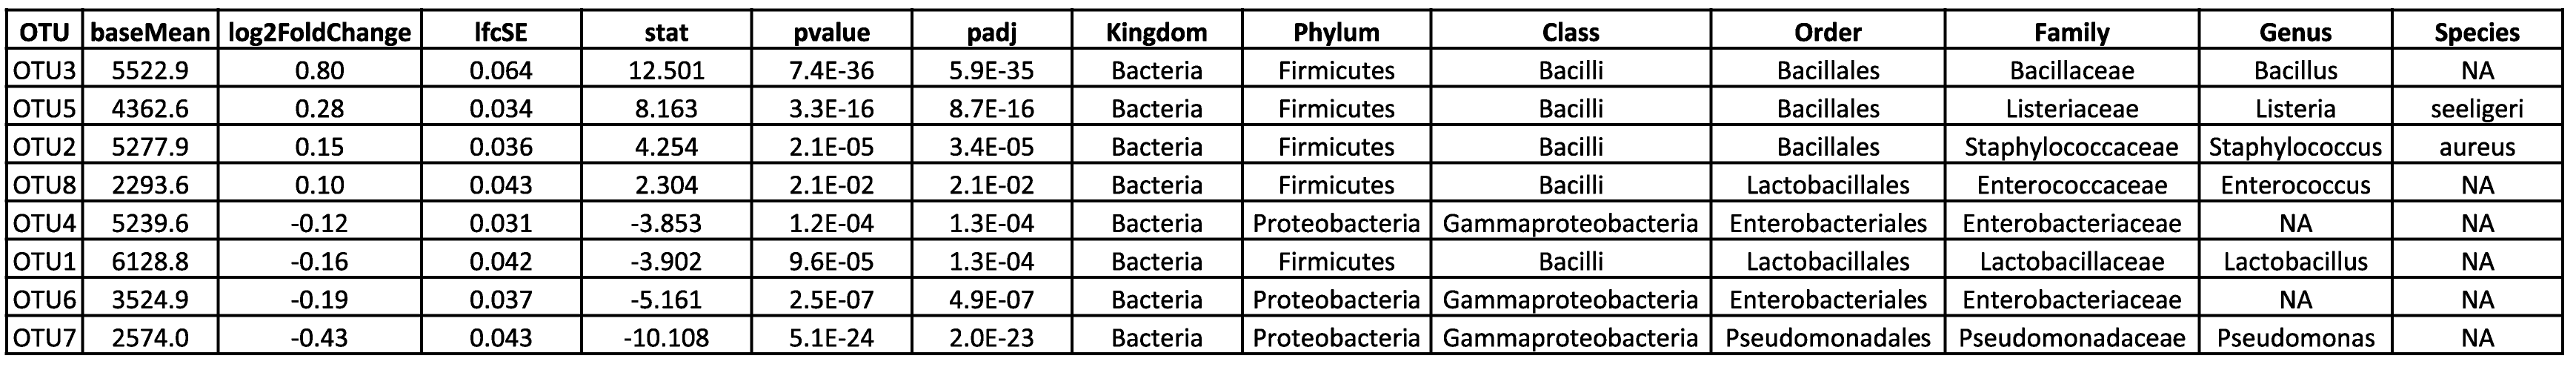
Visualize and interpret complex relationships through principal component analysis. - Differential ASV Analysis (in .tsv and .html format, see Table 2)
Identify and explore differential ASVs with detailed analysis results available in both tabular and HTML formats. - Visualization of Statistical Analysis
Access visually informative representations of statistical analyses.
These additional services provide a deeper layer of understanding and interpretation, enhancing your ability to extract valuable insights from your samples.
2. Functional Profiling
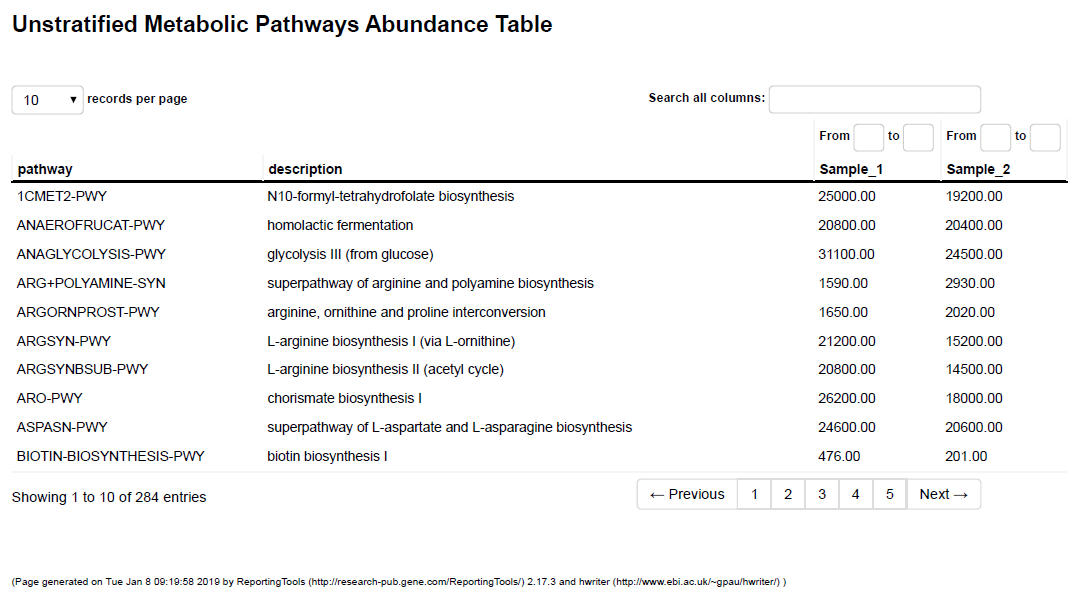
- Inference and Prediction of Functional Profiles (.tsv and .html format, see Table 3)
Predict the functional genetic potential of your samples based on surveys and full genetic information of the identified taxa.
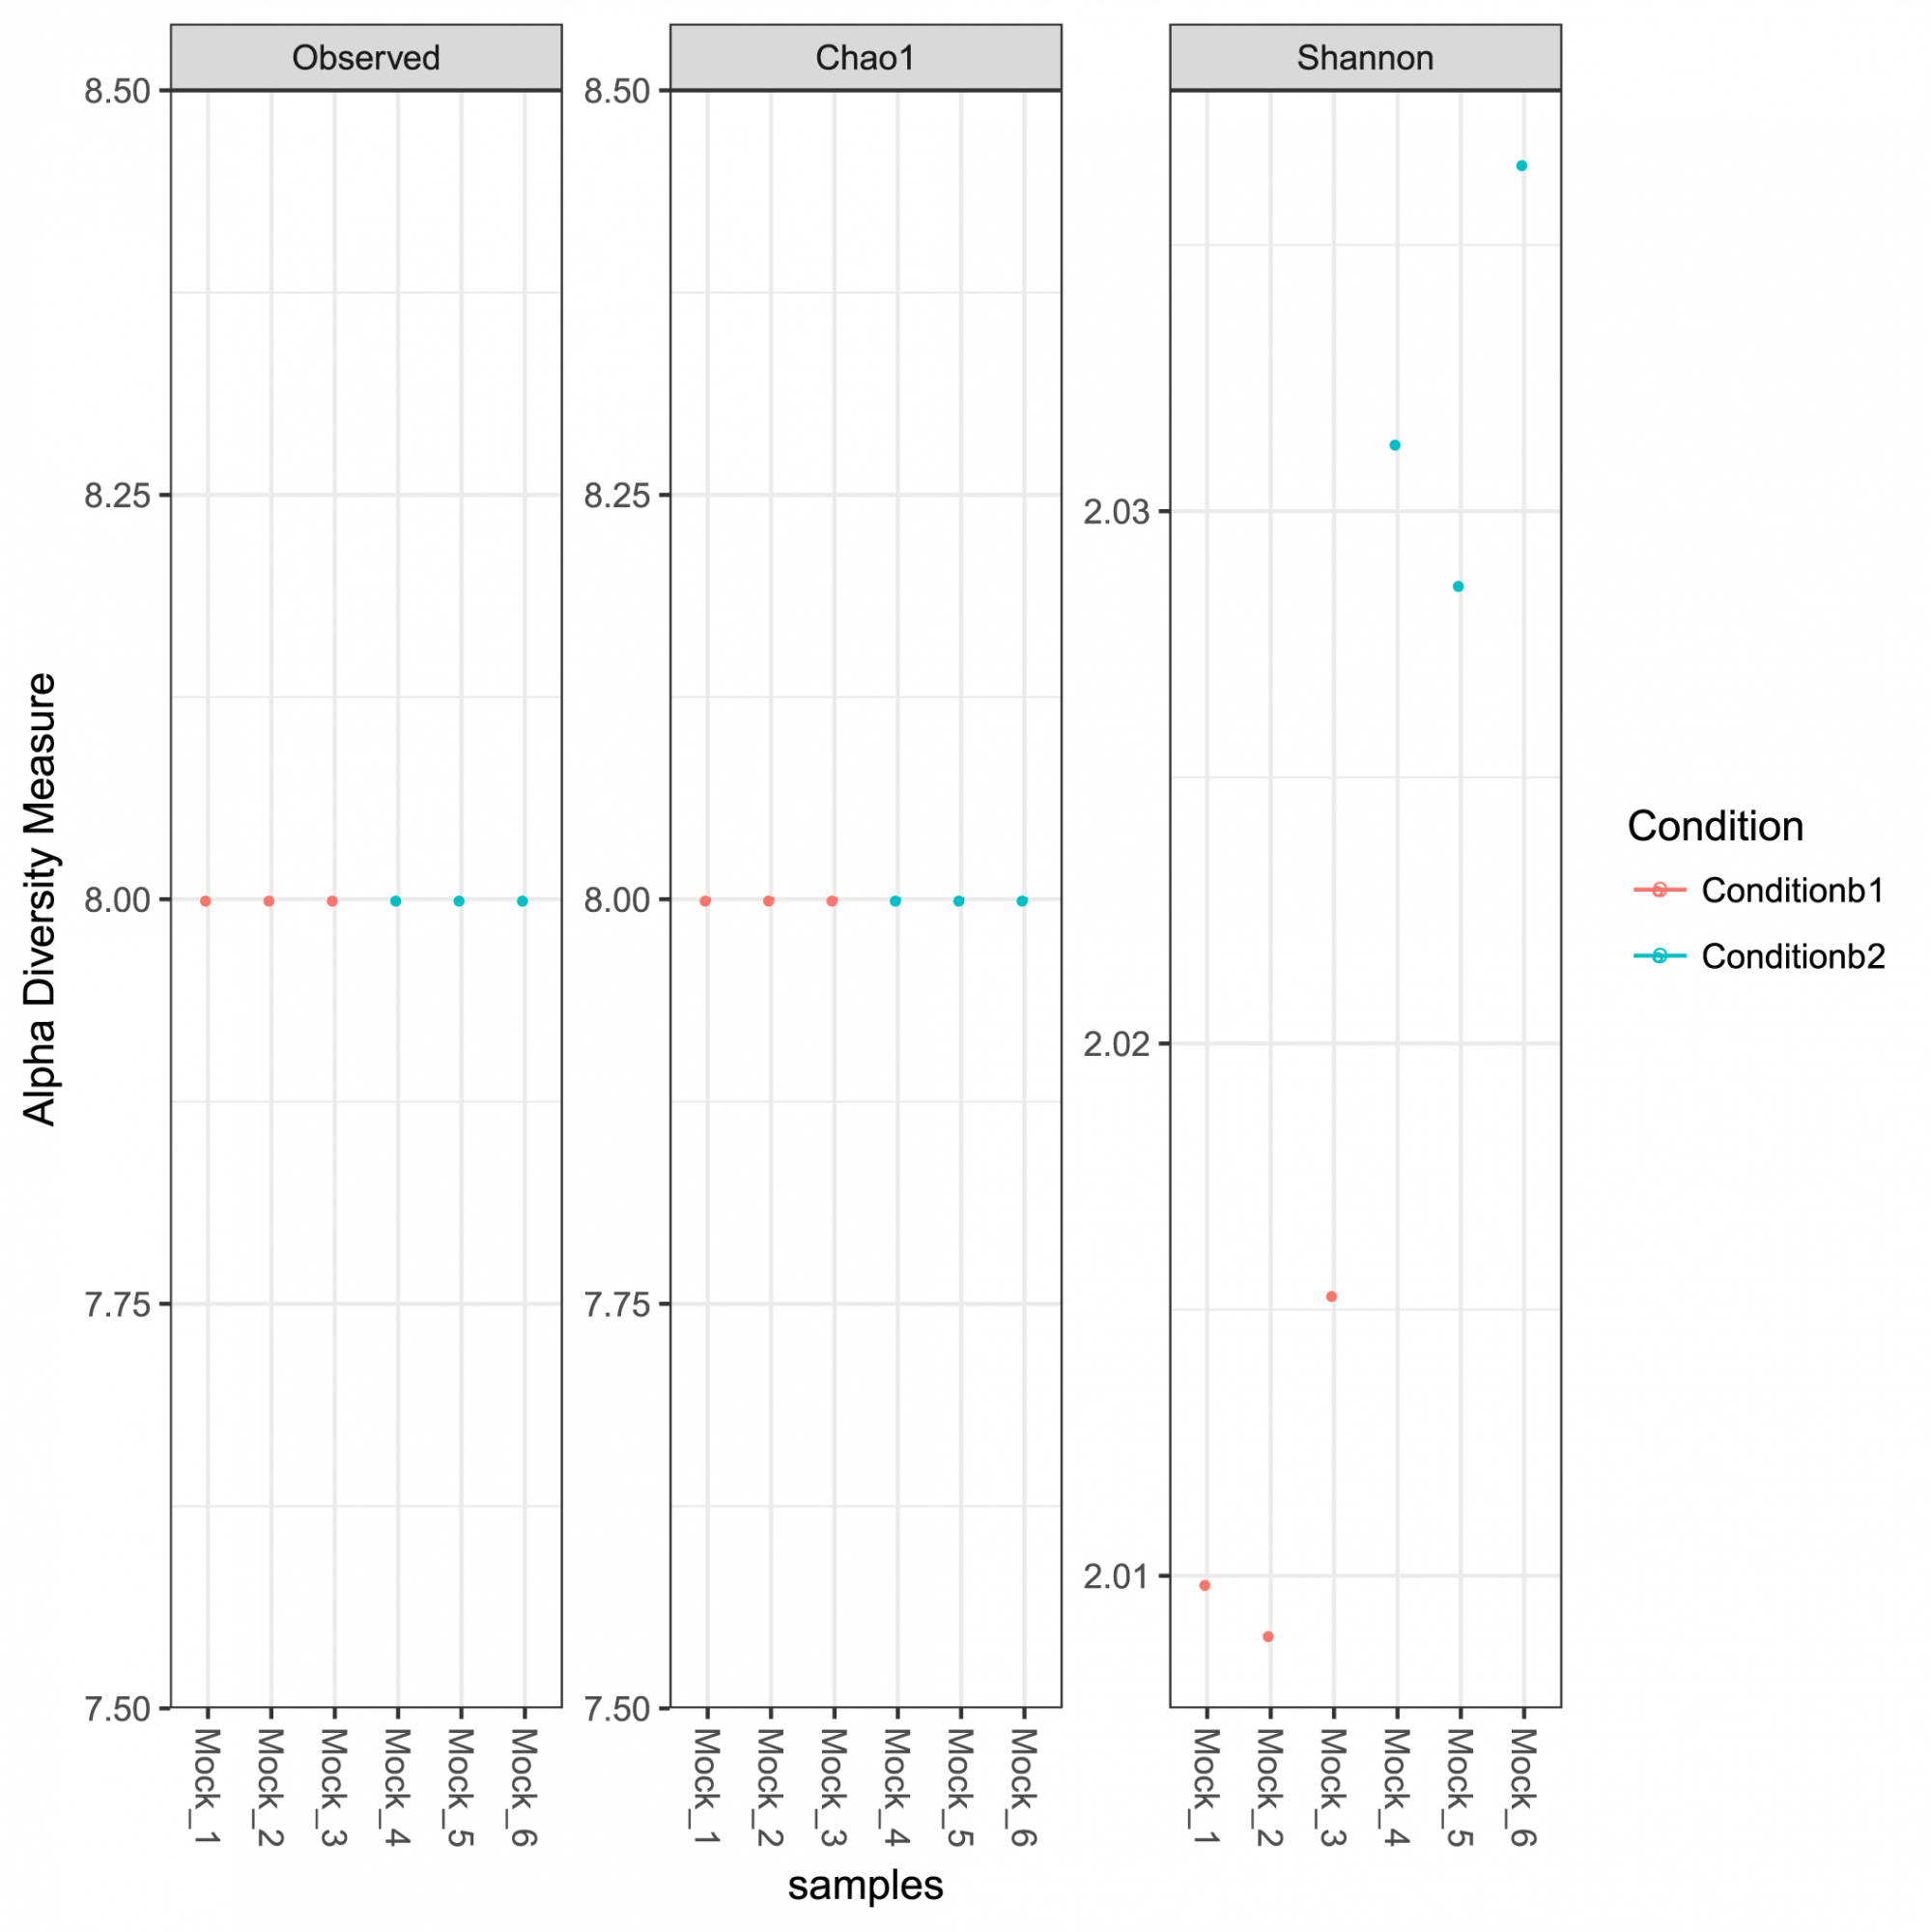
Figure 1: Alpha diversity measures for the analyzed community including observed richness, Chao 1 indices representing the estimated richness and the Shannon diversity indices.
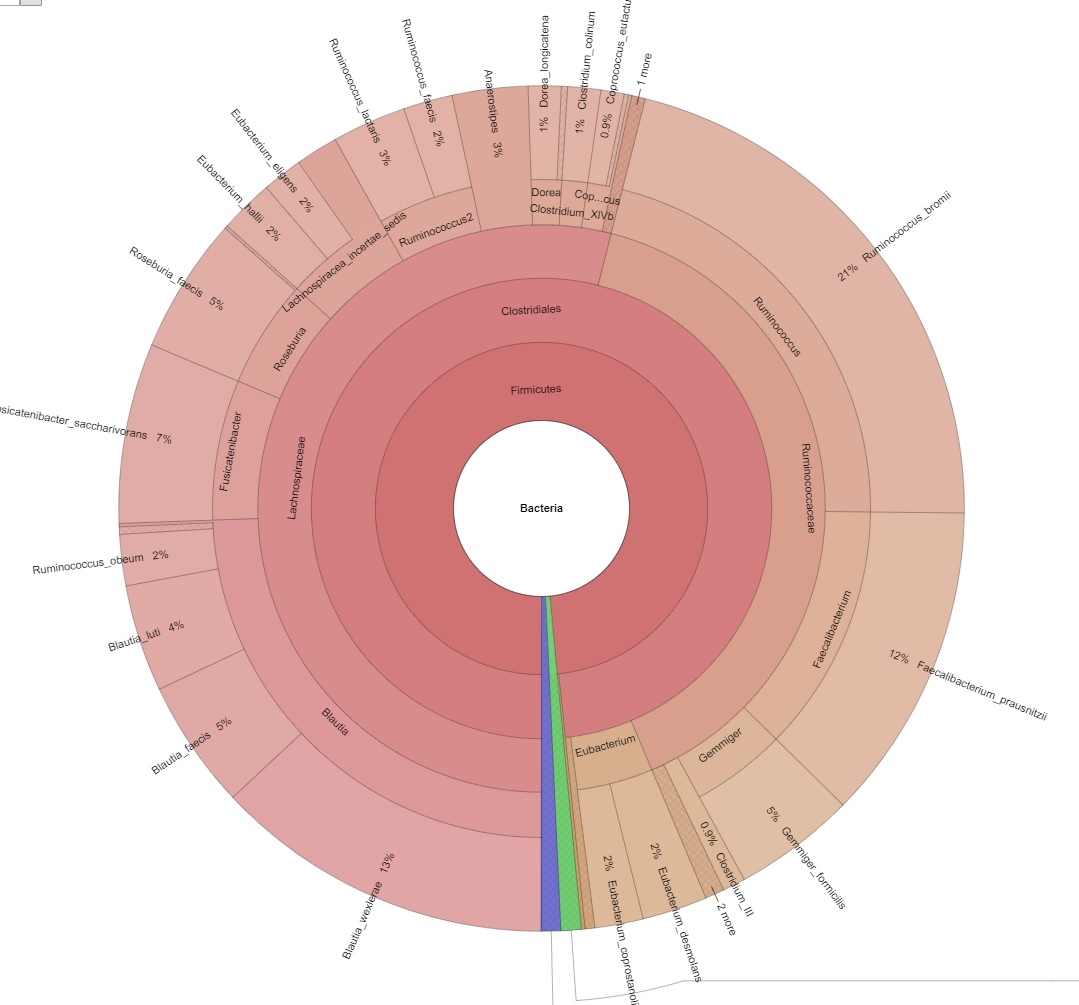
Figure 2: Picture of an interactive Krona chart.
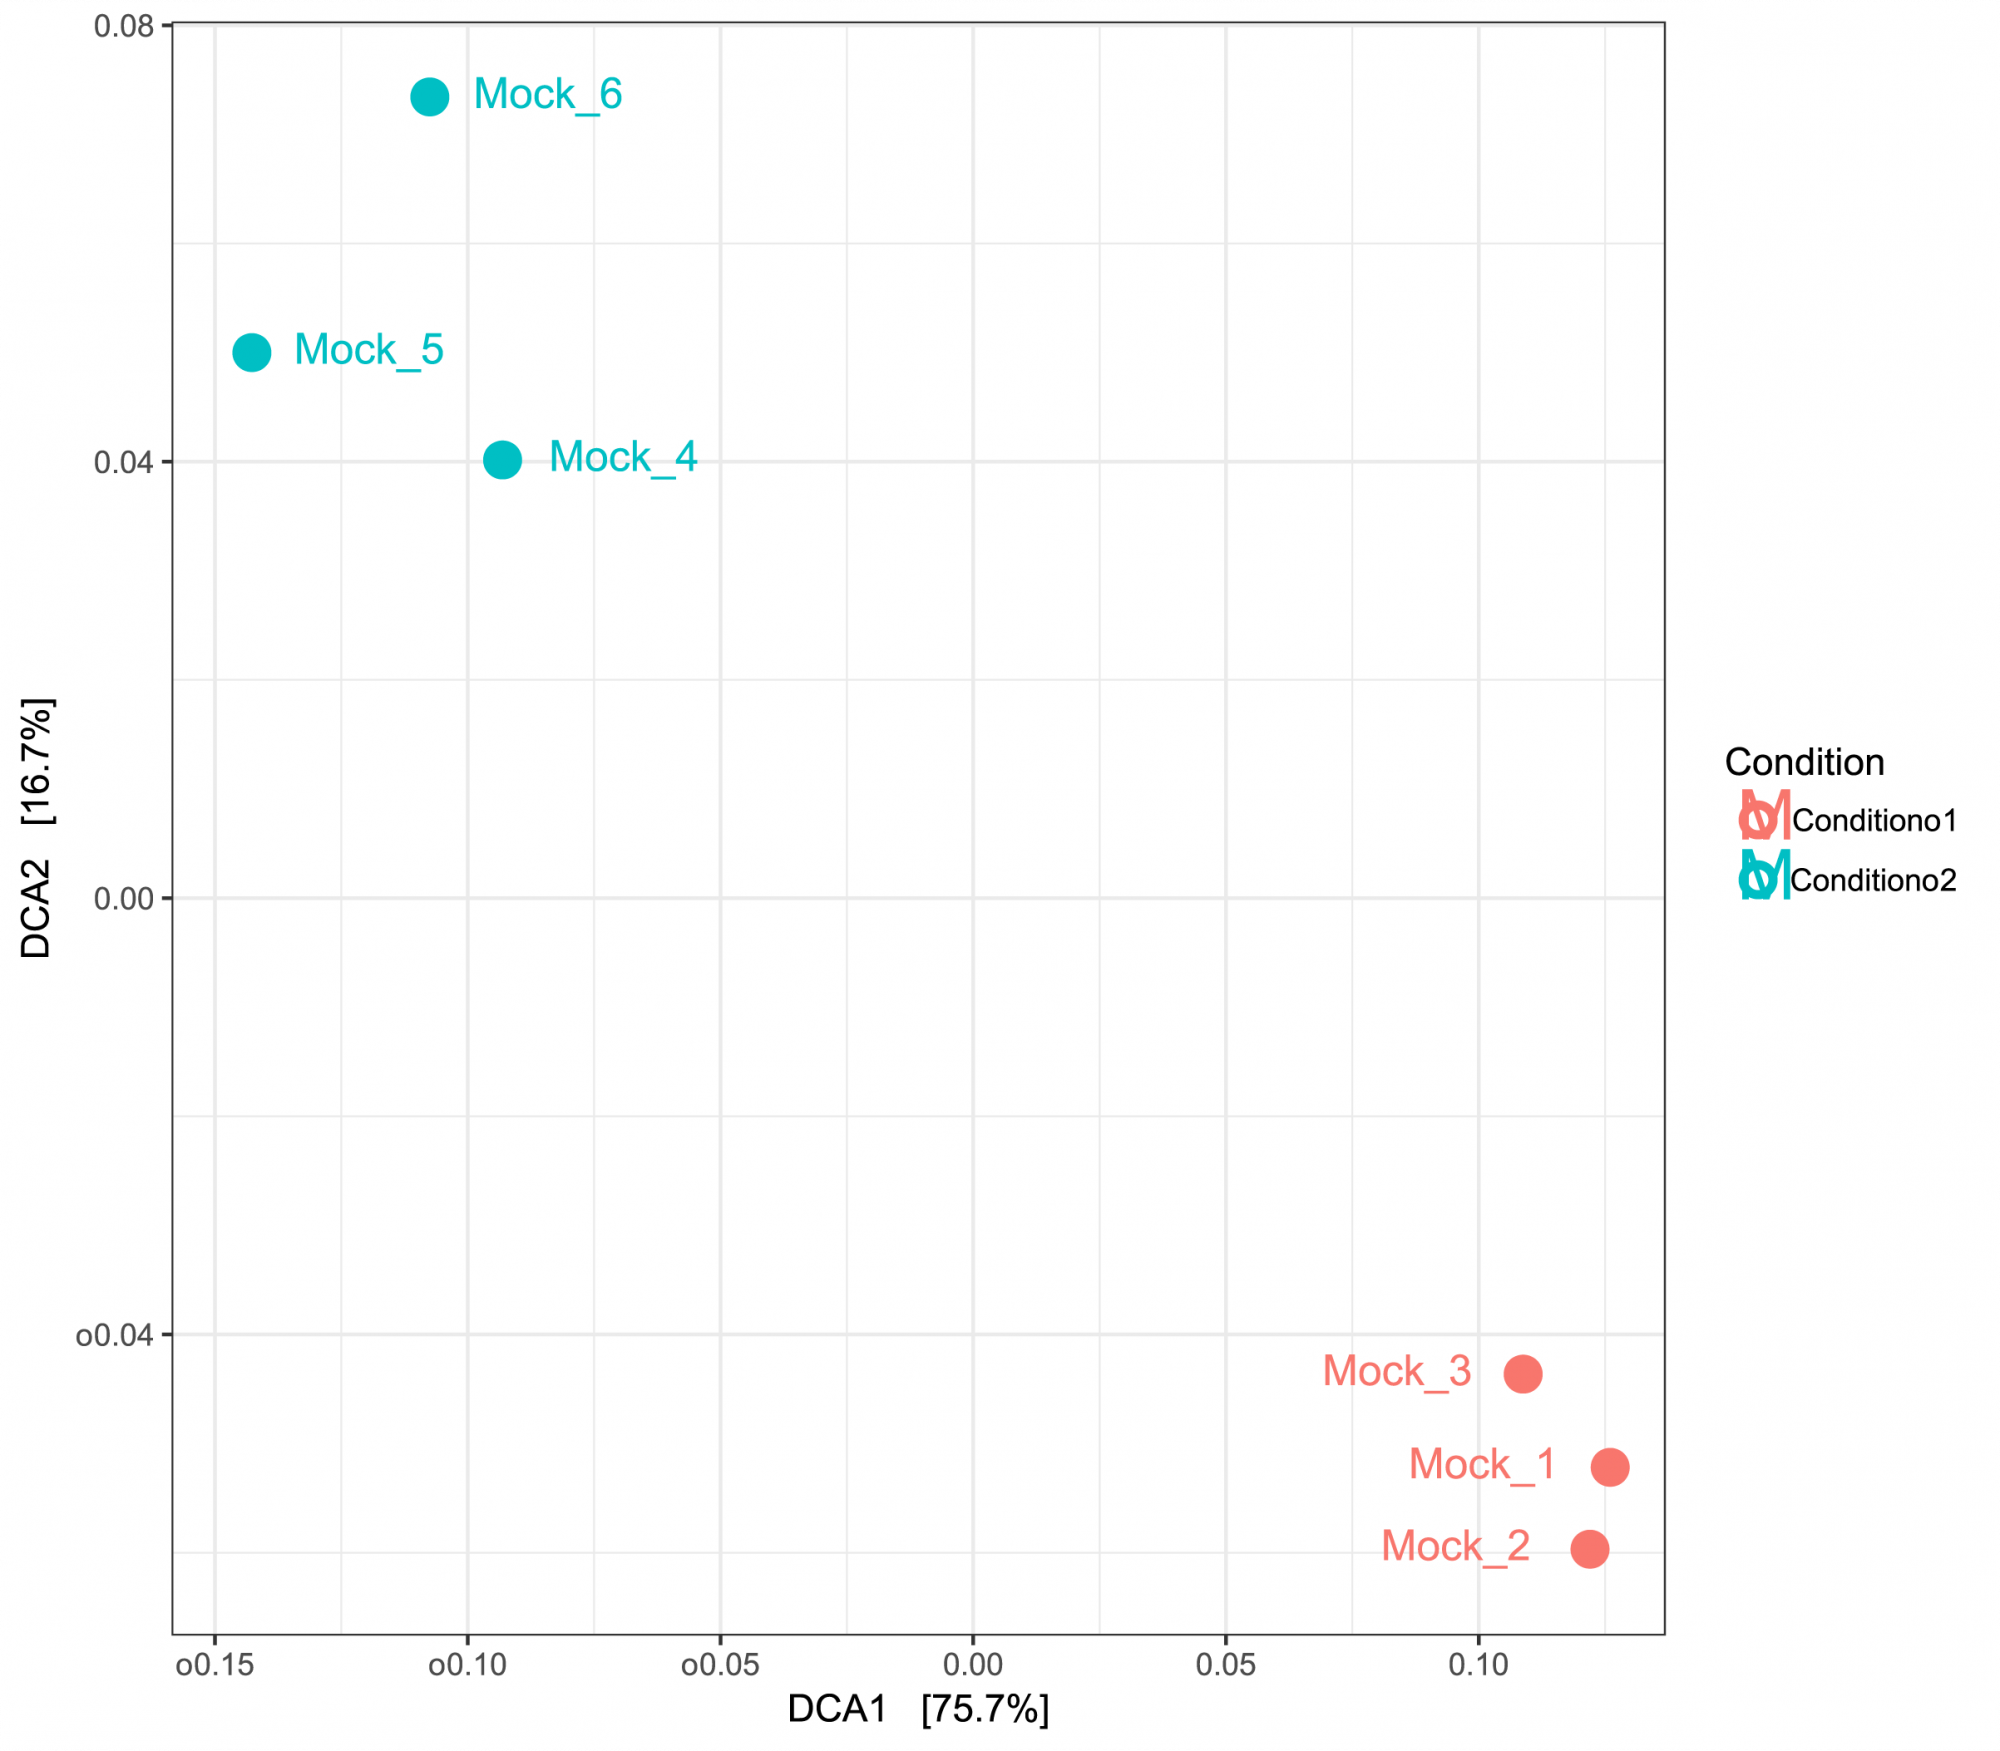
Figure 3: PCA based on UniFrac distances displaying inter-sample similarities. Samples were grouped by two conditions.
Turnaround Time
- Delivery of data within 20 working days upon sample receipt (includes library preparation and sequencing)
- Additional 5 working days for data analysis (bioinformatics)
- Express service possible on request